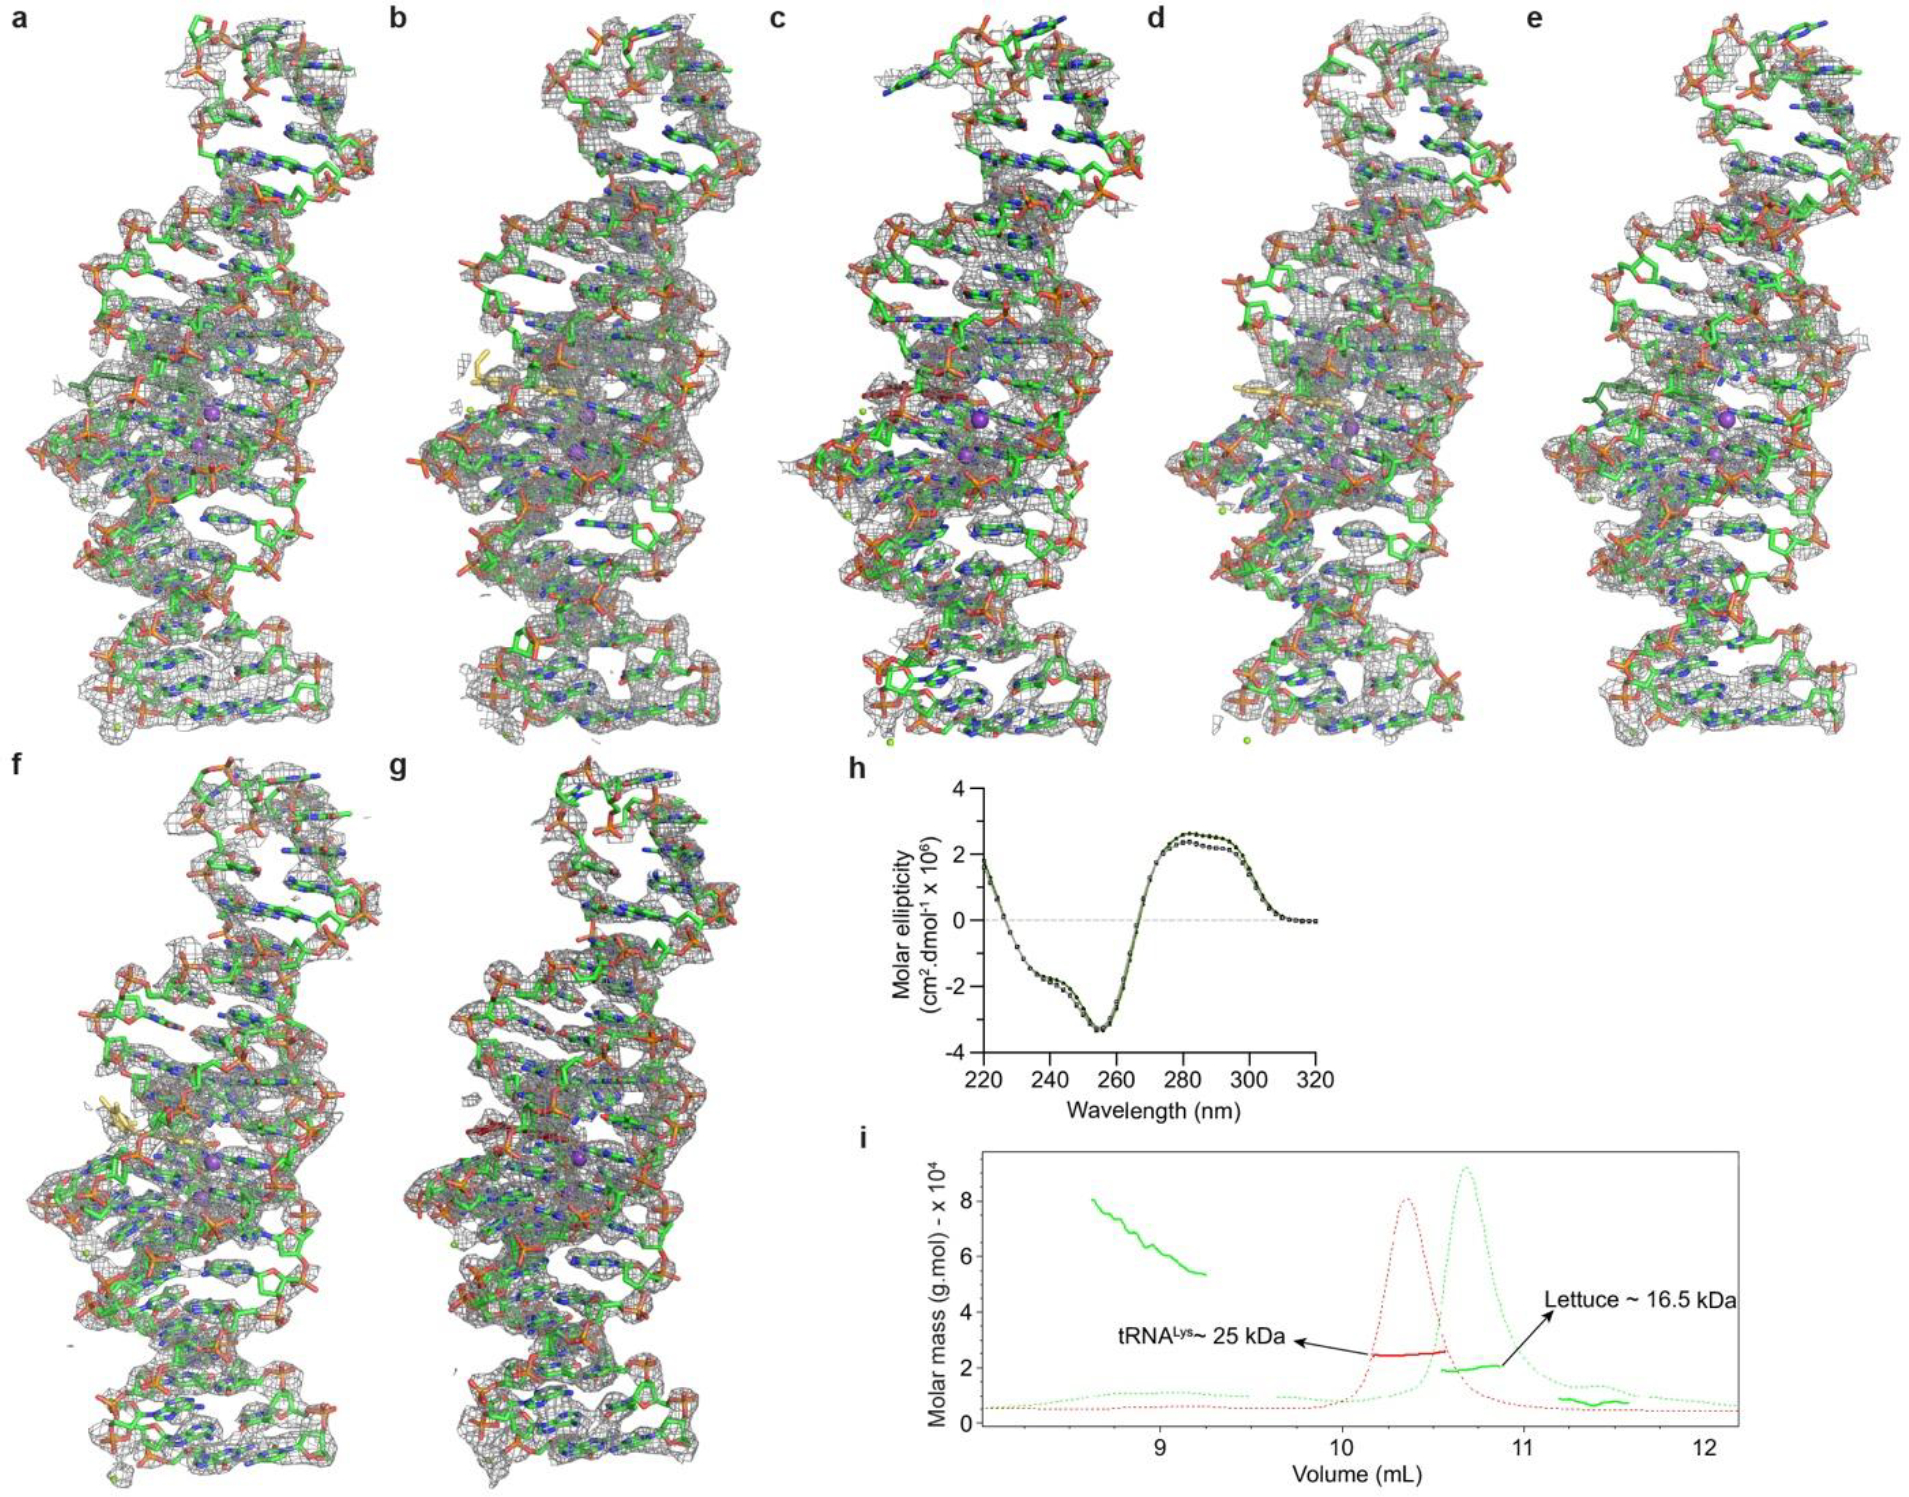
Extended Data Fig. 1. Composite simulated annealing-omit electron density maps for Lettuce-fluorophore complexes and the solution characterization of Lettuce.

Composite simulated annealing-omit 2|Fo| − |Fc| electron density map for the a, Lettuce-DFHBI-1T, b, Lettuce-DFHO, c, Lettuce-DFAME, d, Lettuce(C20G)-DFHO, e, Lettuce (C20T)-DFHBI-1T, f, Lettuce (C20T)–DFHO, g, Lettuce (C20T)–DFAME complexes contoured at 1.0 σ (gray mesh), superimposed on the respective final refined models. h, Circular dichroism spectra of Lettuce–DFHBI1T (green) and unliganded Lettuce (gray) recorded at 21°C. i, Size-exclusion chromatography-multi-angle light scattering (SEC-MALS) analysis of unliganded Lettuce. Dashed green line is absorbance at 280 nm for unliganded Lettuce, and red line is absorbance at 280 nm for tRNALys control. Colored dots correspond to calculated molar mass (red is tRNALys control, and green is unliganded Lettuce). Exclusion limit (V0 ) for this column is at 4.5 mL (not shown).
