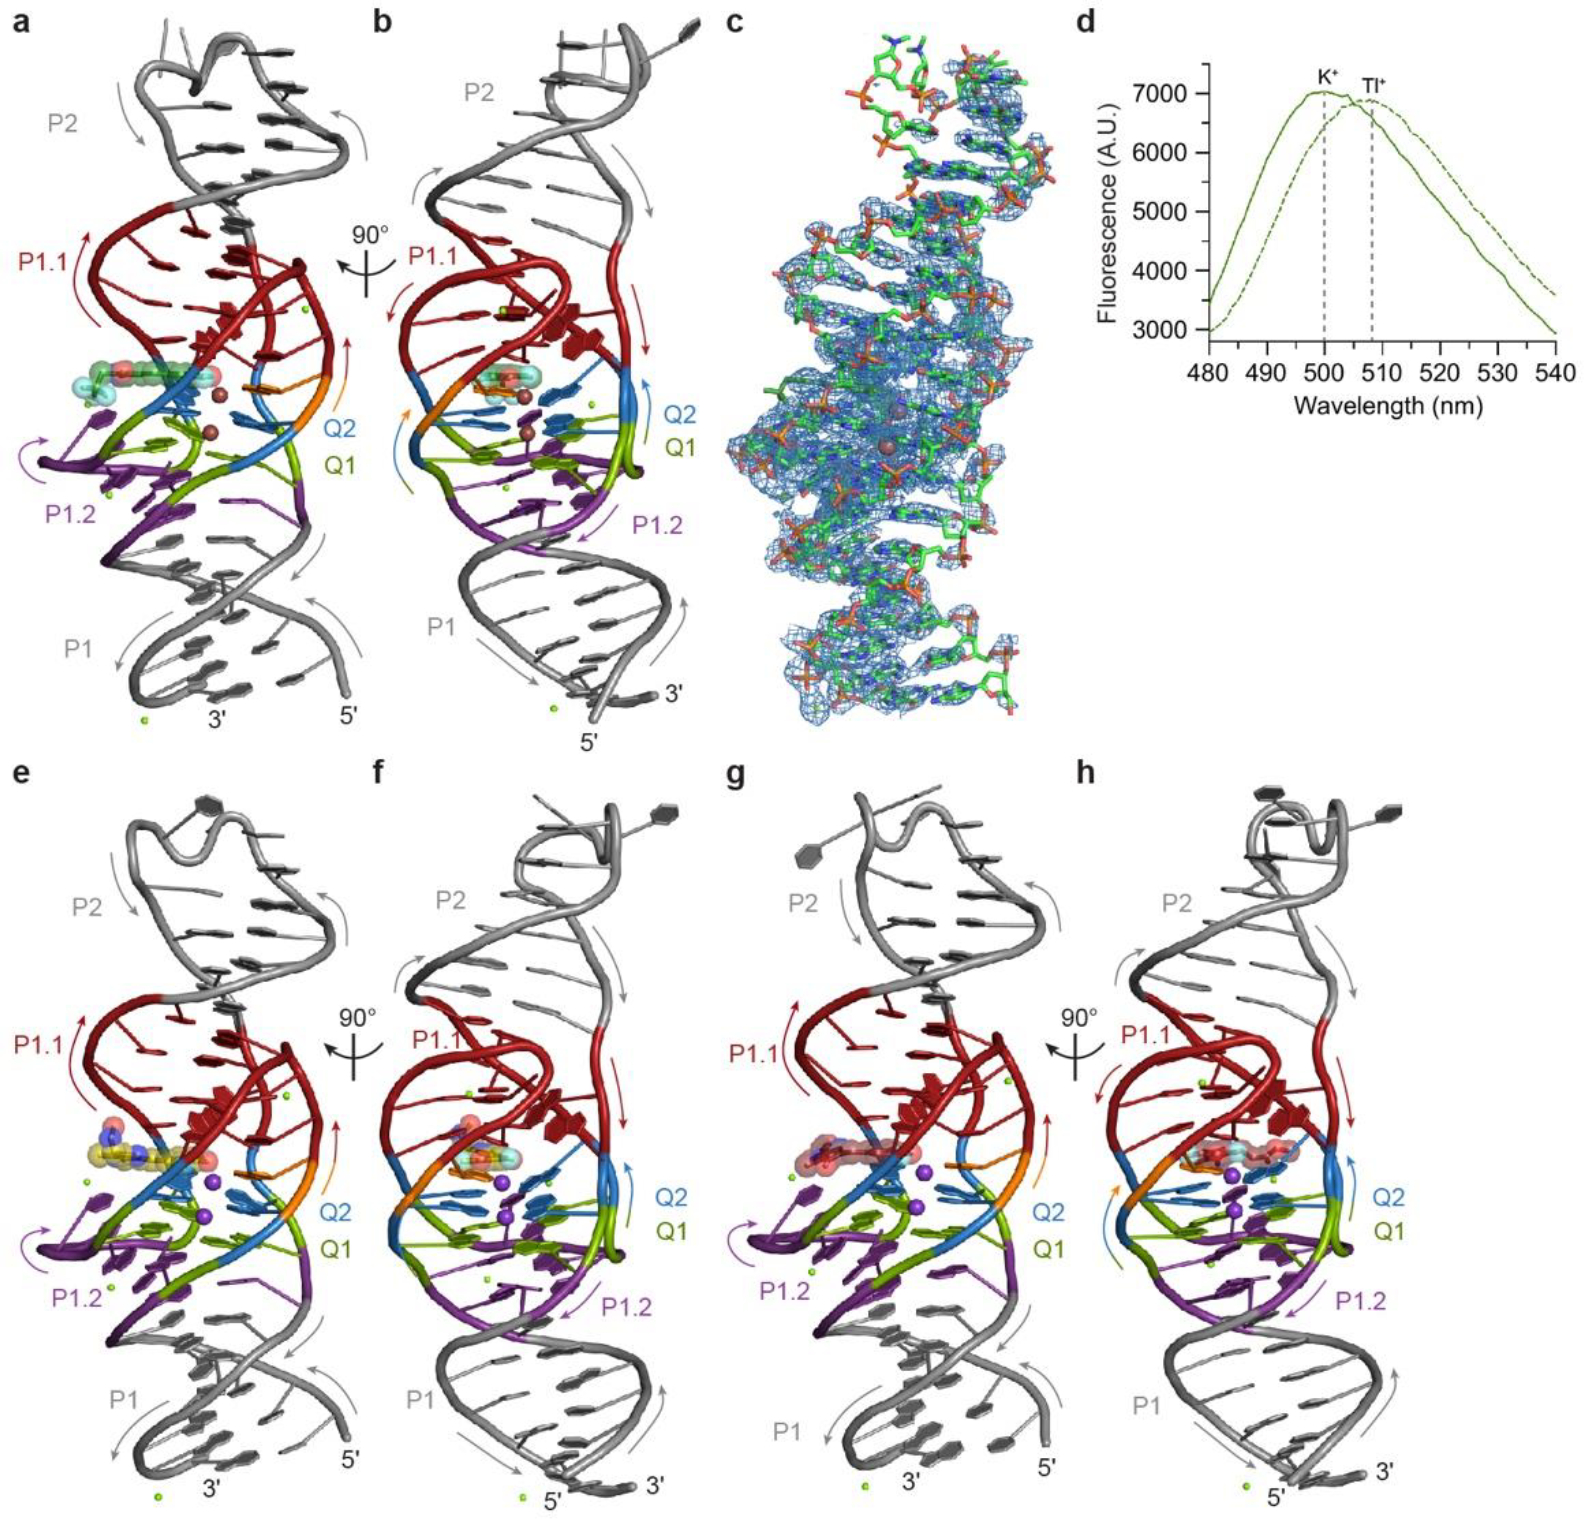
Extended Data Fig. 3. Lettuce–DFHBI-1T in complex with thallium (I) and overall structures of Lettuce in complex with DFHO and DFAME.

a, Cartoon representation of the Lettuce–DFHBI-1T Tl+ complex. Arrows denote 5′ to 3′ chain direction, brown and green spheres represent Tl+ and Mg2+, respectively. The bound DFHBI-1T molecule is shown in ball-and-stick representation with translucent spheres. DNA color as in Fig. 1c. b, Orthogonal view of a. c, Density-modified SAD electron density map for the Lettuce–DFHBI-1T Tl+ complex contoured at 1.0 σ (blue mesh), superimposed on the final refined model. d, Emission spectra of Lettuce–DFHBI-1T in the presence of K+ (solid green line) or Tl+ (dashed green line). e, Cartoon representation of the Lettuce–DFHO complex. Arrows indicate 5′ to 3′ chain direction, purple and green spheres represent K+ and Mg2+, respectively. The bound DFHO molecule is shown in ball-and-stick representation with translucent spheres. DNA color as in Fig. 1c. f, Orthogonal view of e. g, Cartoon representation of the Lettuce–DFAME complex. Arrows indicate 5′ to 3′ chain direction, purple and green spheres represent K+ and Mg2+, respectively. The bound DFAME molecule is shown in ball-and-stick representation with translucent spheres. DNA color as in Fig. 1c. h, Orthogonal view of g.
