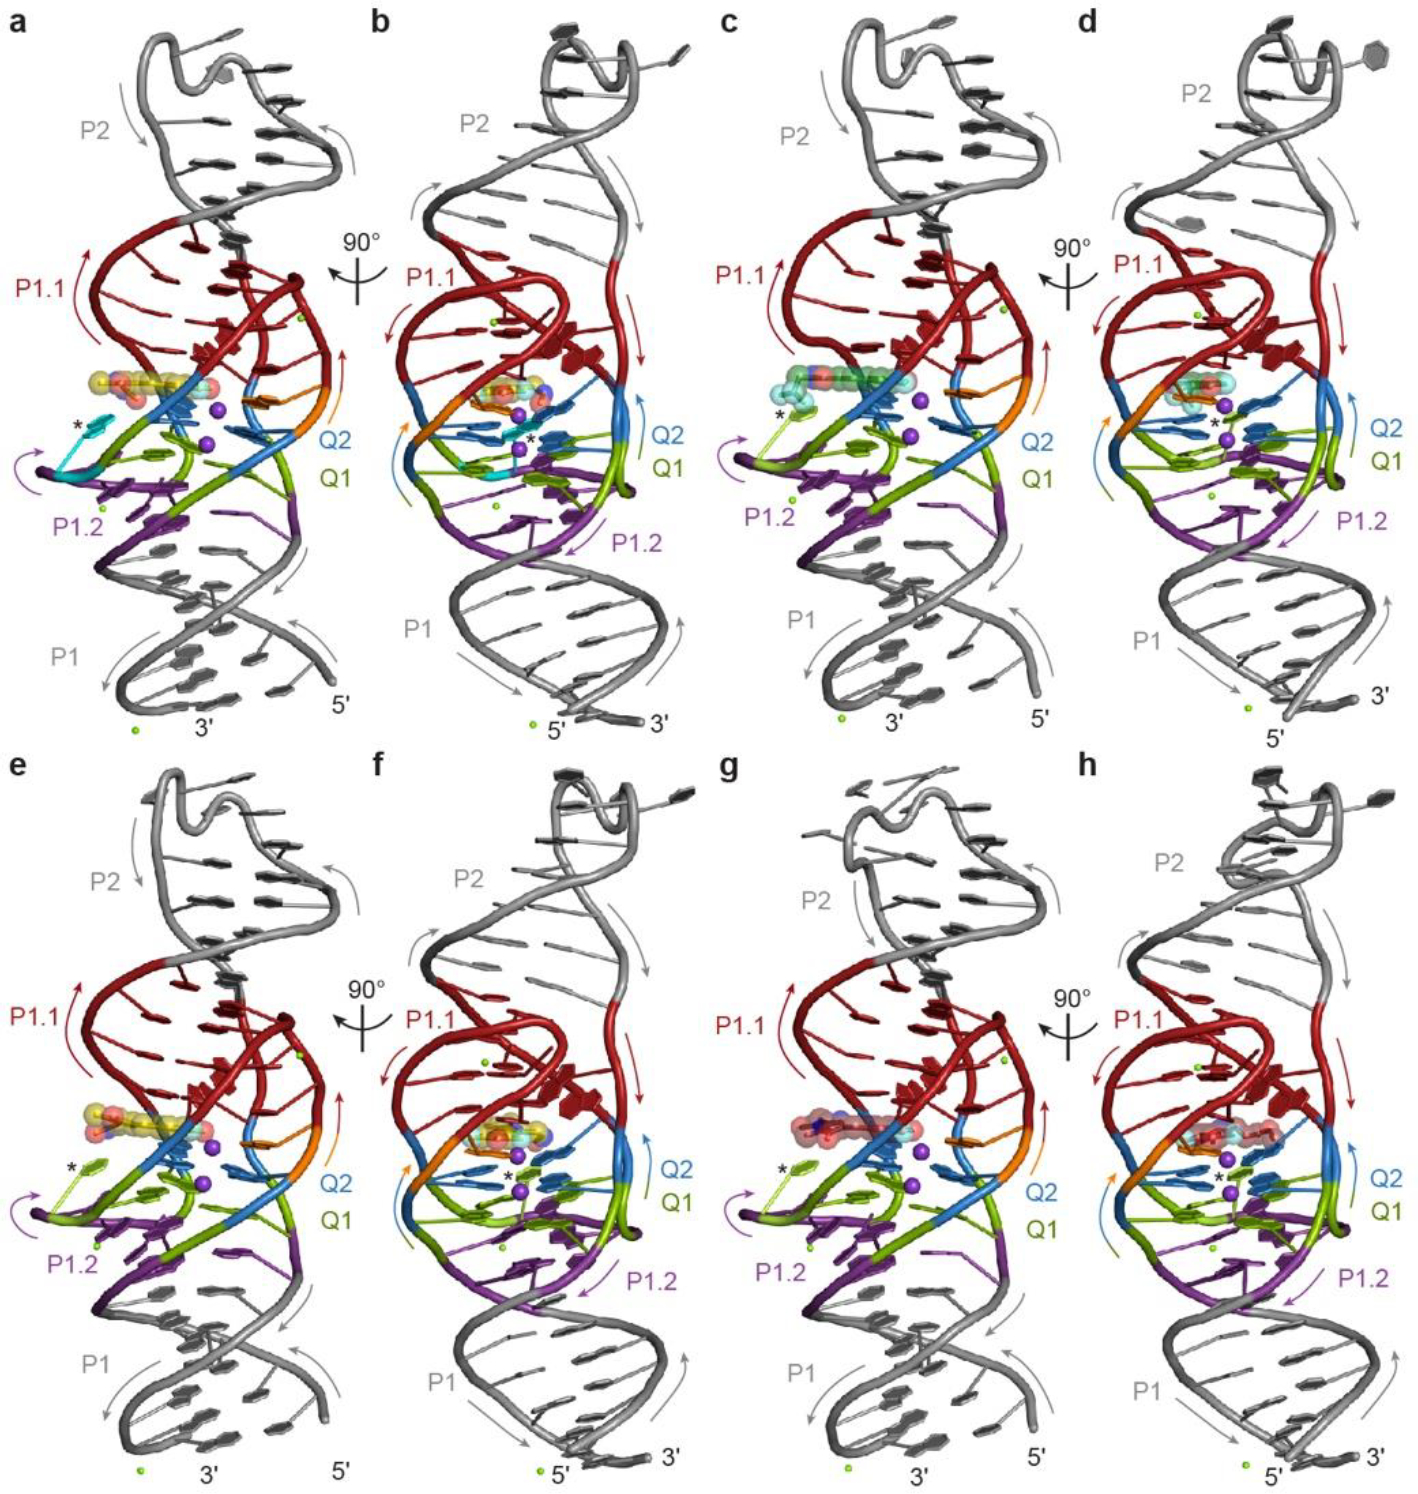
Extended Data Fig. 4. Overall structure of Lettuce C20 specificity mutants complexed with different fluorophores.

a, Cartoon representation of the C20G Lettuce–DFHO complex. Arrows indicate 5′ to 3′ chain direction, purple and green spheres represent K+ and Mg2+, respectively. Asterisk marks the mutated residue. The bound DFHO molecule is shown in ball-and-stick representation with translucent spheres. DNA color as in Fig. 1c. b, Orthogonal view of a. c, Cartoon representation of the C20T Lettuce–DFHO, e, –DFHBI1T, and g, –DFAME complexes. Arrows indicate 5′ to 3′ chain direction, purple spheres represent K+, and green spheres represent Mg2+. The bound fluorophore molecules are shown in ball-and-stick representation with translucent spheres. Asterisk marks the mutated residue. DNA color as in Fig. 1c. d, Orthogonal view of c. f, Orthogonal view of e. h, Orthogonal view of g.
