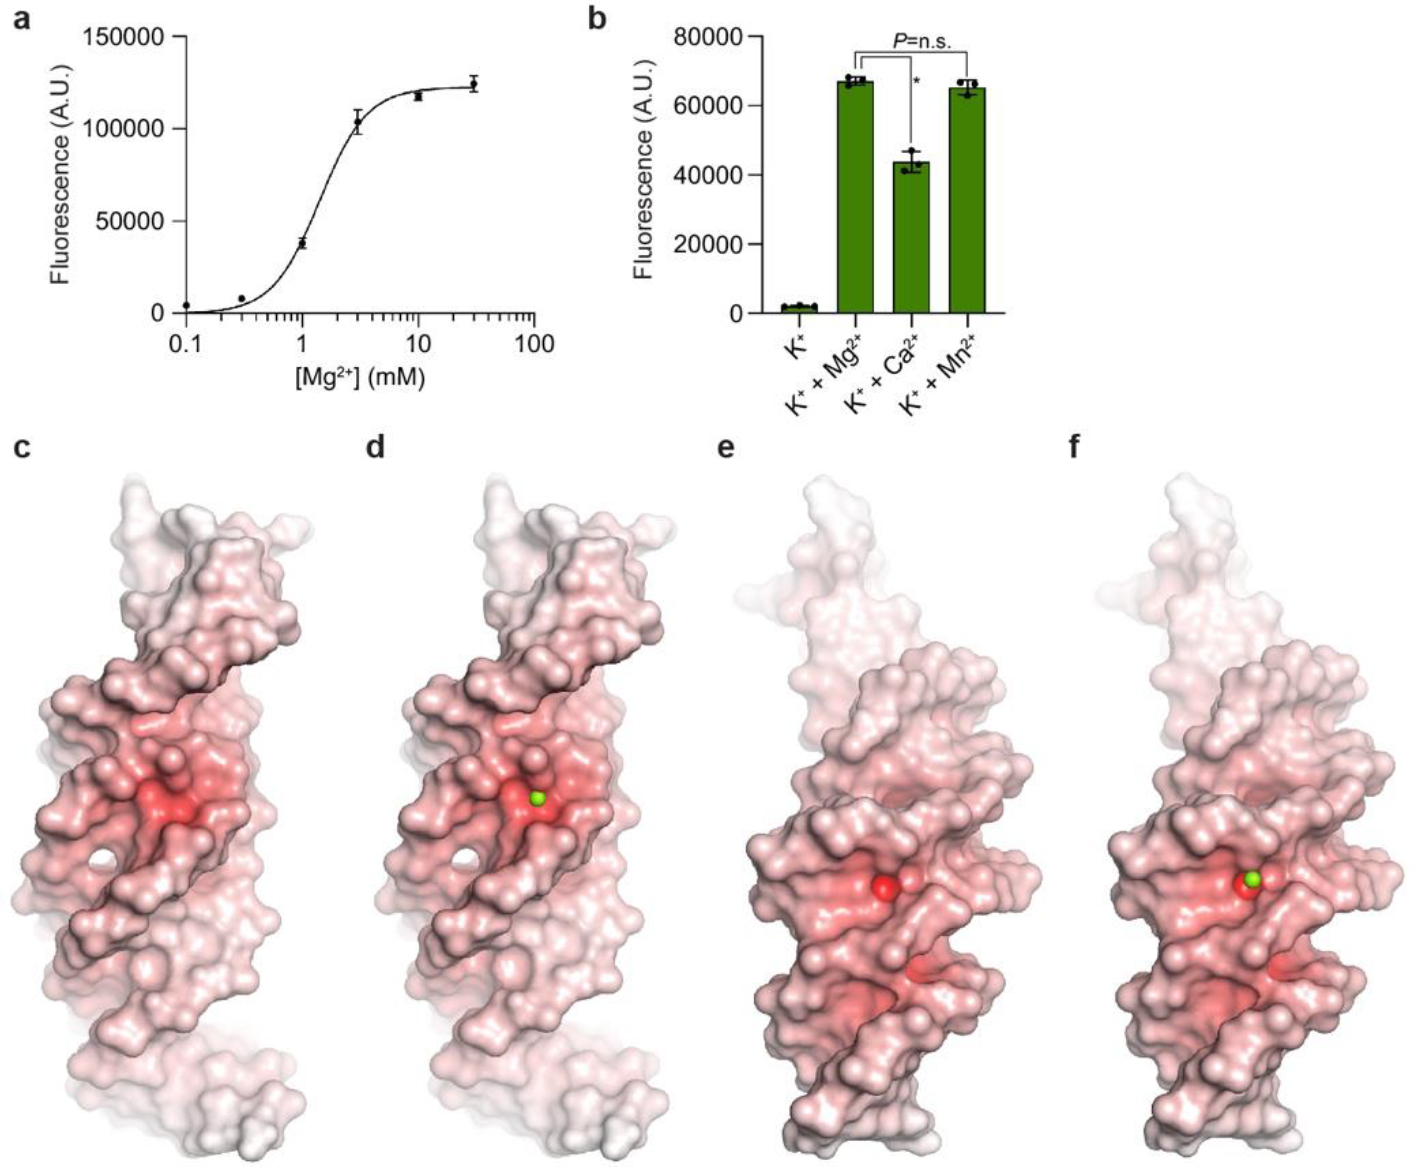
Extended Data Fig. 5. Divalent cation dependence of Lettuce fluorescence.

a, Fluorescence of Lettuce-DFHBI-1T as a function of Mg2+ concentration (in the presence of 150 mM K+). The half-maximal activity (K1/2) is at 1.4 mM Mg2+ (mean ± s.d.; n = 3). b, Fluorescence activation of Lettuce–DFHBI-1T in 150 mM K+ alone, or supplemented with 10 mM Mg2+, Ca2+, or Mn2+ (mean ± s.d., n = 3). * denotes P= 0.0002 (two-sided t-test). No significancy (P= 0.251) between K+ + Mg2+ and K+ + Mn2+ (two-sided t-test). c, Electrostatic potential of Lettuce mapped on its molecular surface. Color ramp from 0 to +20 kBT (white to red). d, Green sphere shows Mg2+ ion bound in the P1.1 loop. e, Molecular surface of Lettuce (same color scheme as c) showing the P1.2 loop at its center. f, Green sphere shows Mg2+ ion bound in the P1.2 loop.
