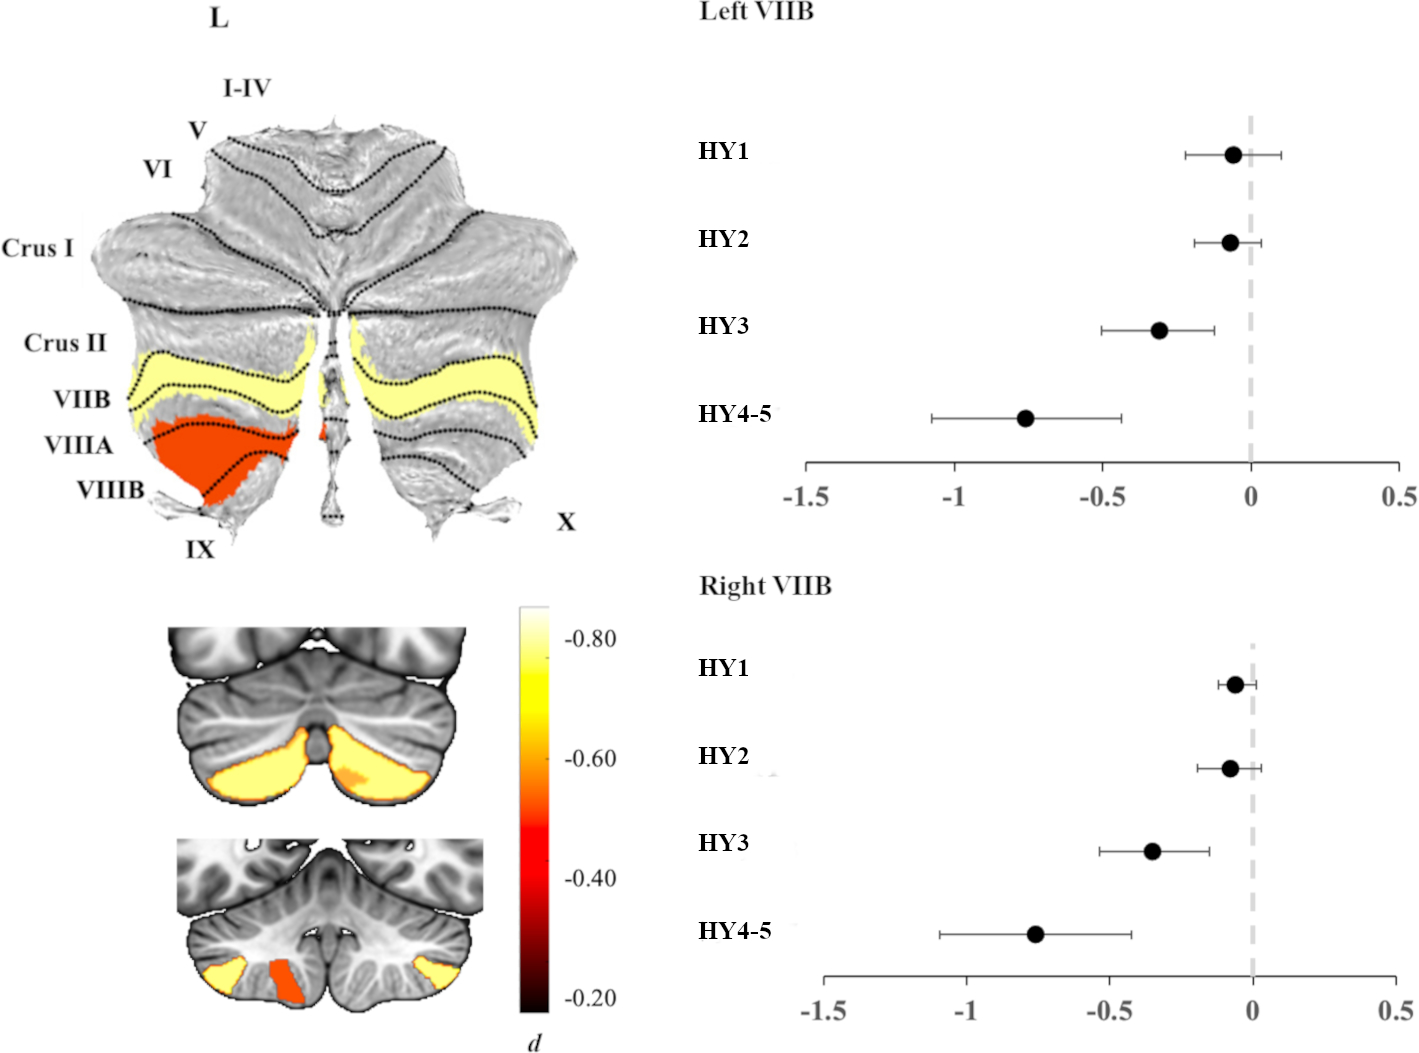
Figure 3.

Left panel: Atlas-based effect size (Cohen’s d) map and MNI-based coronal slices (top: y= −72; bottom: y= −54) of the significant between-group differences for HY4–5 participants vs. controls. Right panel: Effect sizes for left (top) and right (bottom) lobule VIIB cerebellar volume associated with each disease stage. Negative values reflect lower volume in participants compared to controls. Bars represent 95% confidence intervals.
