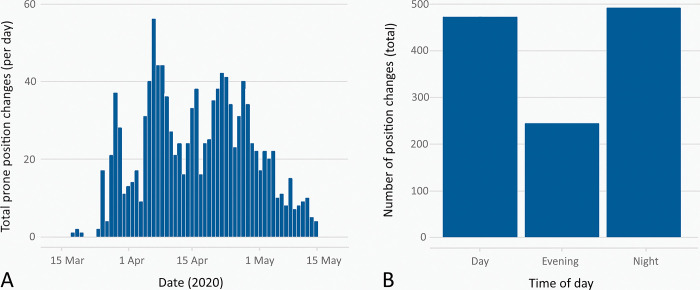
Fig 2. Prone position changes during peak COVID-19 activity on GICU.
Chart A shows the total number of prone position changes which occurred on a given day, during the peak period of activity. Chart B shows the relationship between total prone position changes and the times of day at which they occurred.

