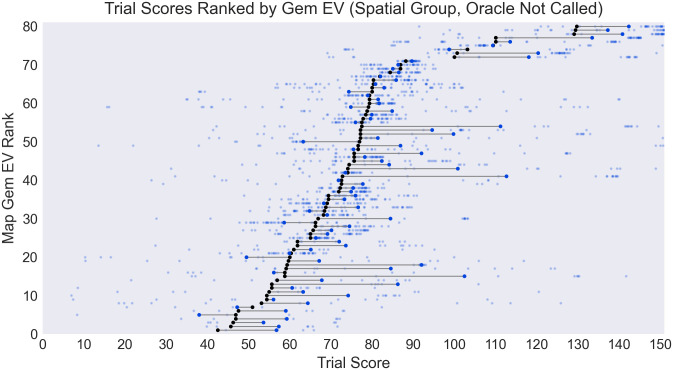
Fig 6. Comparison of trial score across participants who did not call the oracle (transparent blue points, with mean shown by opaque blue dot) versus trial’s expected score under a random policy (black dot).
Mean performance was above expectation for most trials indicating that spatial information was exploited when participants chose not to call the oracle. Maps are ranked by expected score (“Gem EV Rank”).

