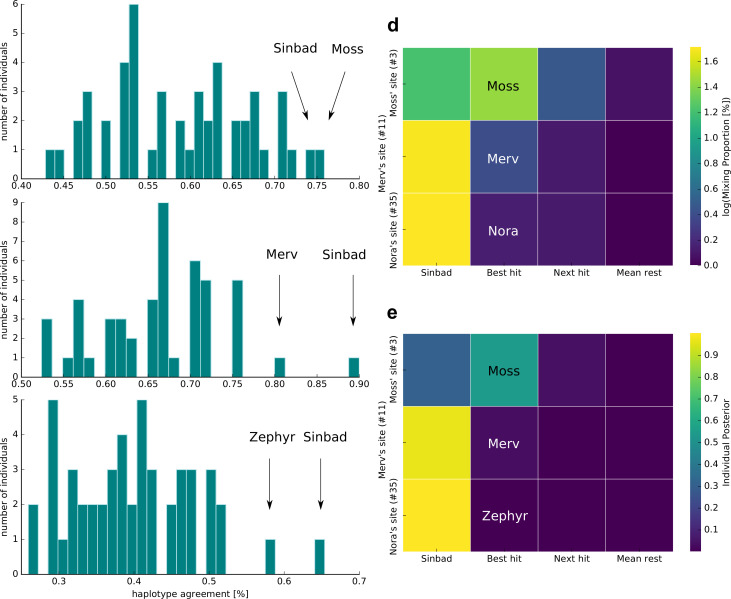
Figure 3. Individual identification from soil nanopore sequencing data.
(a–c) Distribution of haplotype agreement scores between all Whenua Hou kākāpō and (a) soil sample 3 (Moss’ display site), (b) soil sample 11 (Merv’s display site), and (c) soil sample 35 (Nora’s feeding station). (d) Mixing proportions [%; log10 scale] and (e) posterior means of individual assignment per sample (y-axis) assessed through Bayesian inference of individual assignments (see Materials and methods). The heatmaps show Sinbad’s omnipresent signal in the first column, the best hit when disregarding Sinbad in the second column, the second-best hit in the third column, and the mean values of all remaining Whenua Hou kākāpō in the last column.


