. 2023 Dec 28;12:e83103. doi: 10.7554/eLife.83103

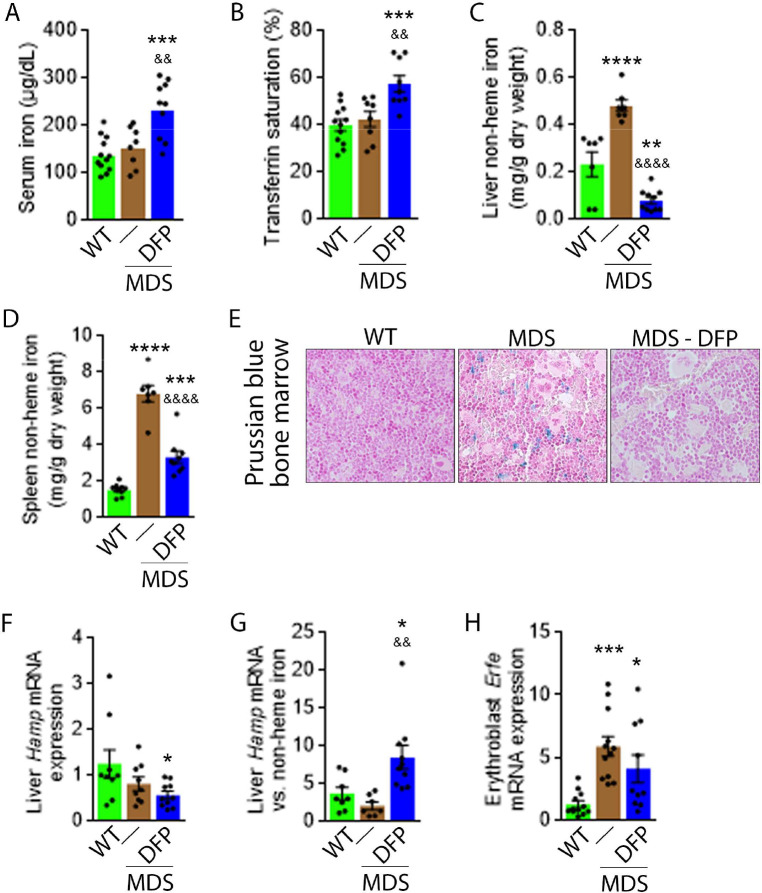
Figure 1. DFP reverses parenchymal iron overload and restores hepcidin iron responsiveness in MDS mice.

DFP results in increased serum iron (A) and transferrin saturation (B) while reducing parenchymal iron in the liver, spleen, and bone marrow (C-E). While liver Hamp mRNA expression is unchanged in WT, MDS, and DFP-treated MDS mice (F), Hamp responsiveness to iron is normalized in DFP-treated MDS mice (G) (n=7–10 mice/group). (H) DFP results in more normal Erfe mRNA expression (n=10–12 mice/group) in sorted bone marrow erythroblasts from MDS mice analyzed after 1 month of treatment. *p<0.05 vs. WT; **p<0.01 vs. WT; ***p<0.001 vs. WT; ****p<0.0001 vs. WT; &p<0.05 vs. MDS; &&p<0.01 vs. MDS; &&&&p<0.0001 vs. MDS; Abbreviations: WT = wild type; MDS = myelodysplastic syndrome; DFP = deferiprone; Hamp = hepcidin; Erfe = erythroferrone.

Figure 1—source data 1. Source data for iron-related parameters in wild type (WT), myelodysplastic syndrome (MDS), and DFP-treated MDS mice.

Figure 1.

Figure 1—figure supplement 1. Erythroblast apoptosis in MDS mice.
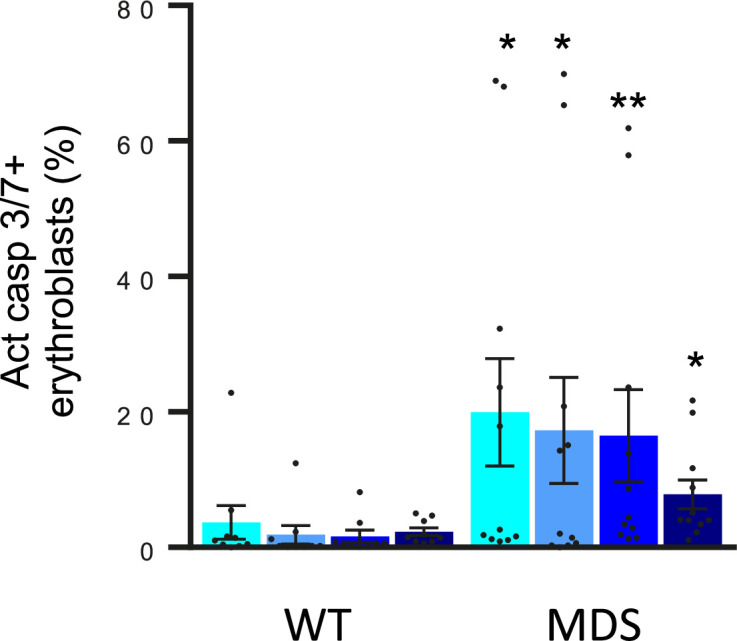
Figure 1—figure supplement 1.

Bone marrow erythroblasts were isolated using flow gating strategy and apoptosis was measured using activated caspase 3/7. Erythroblast apoptosis is elevated in ProE, BasoE, PolyE, and OrthoE from MDS mice (n=9–11 mice/group). *p<0.05 vs. WT; **p<0.01 vs. WT; WT = wild type; MDS = myelodysplastic syndrome; ProE = pro-erythroblasts; BasoE = basophilic erythroblasts; PolyE = polychromatophilic erythroblasts; OrthoE = orthochromatophilic erythroblasts; Act casp 3/7=activated caspase 3 and 7.
Figure 1—figure supplement 1—source data 1. Source data for flow analysis of apoptosis measured by activated caspase 3/7 in bone marrow erythroblasts from wild type (WT) and myelodysplastic syndrome (MDS) mice.
Figure 1—figure supplement 2. Quantification of serum DFP concentration in DFP-treated WT and MDS mice.
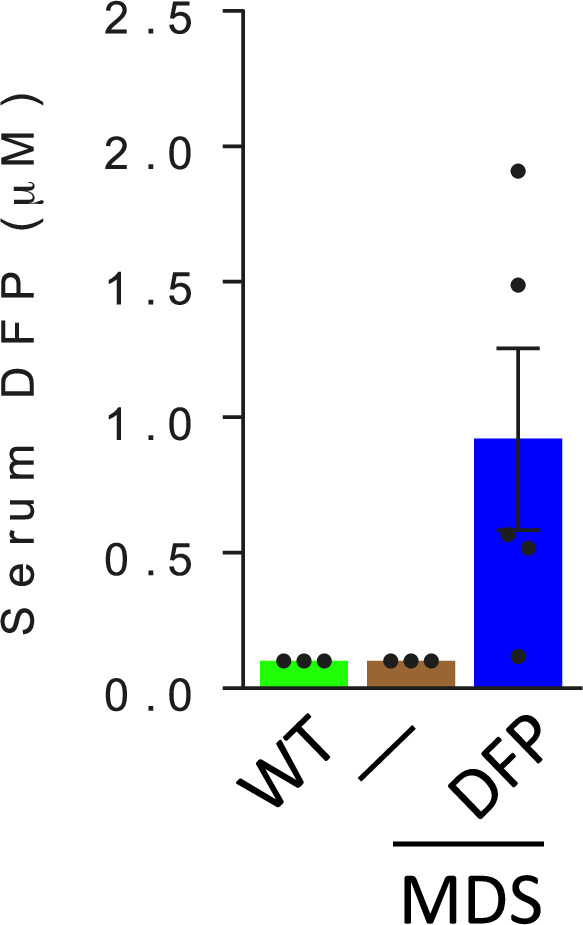
Figure 1—figure supplement 2.

Serum DFP concentration is measurable in DFP-treated MDS mice. (n=3–5 mice/group). WT = wild type; MDS = myelodysplastic syndrome; DFP = deferiprone.
Figure 1—figure supplement 2—source data 1. Source data for serum deferiprone (DFP) concentration in DFP-treated wild type (WT) and myelodysplastic syndrome (MDS) mice.
Figure 1—figure supplement 3. DFP resulted in similar effects on transferrin saturation in male and female MDS mice.
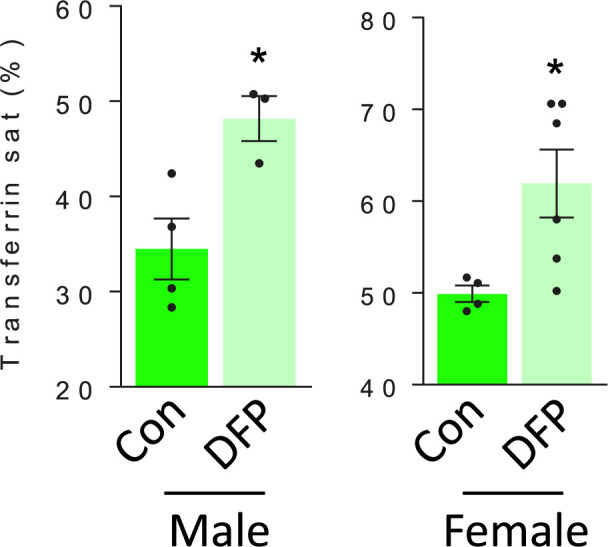
Figure 1—figure supplement 3.

Similarly elevated transferrin is observed in male and female DFP-treated MDS mice (n=3–4 male mice/group and n=4–6 female mice/group). *p<0.05 vs. control; Con = control; DFP = deferiprone; sat = saturation.
Figure 1—figure supplement 3—source data 1. Source data for transferrin saturation in male and female myelodysplastic syndrome (MDS) and DFP-treated MDS mice.
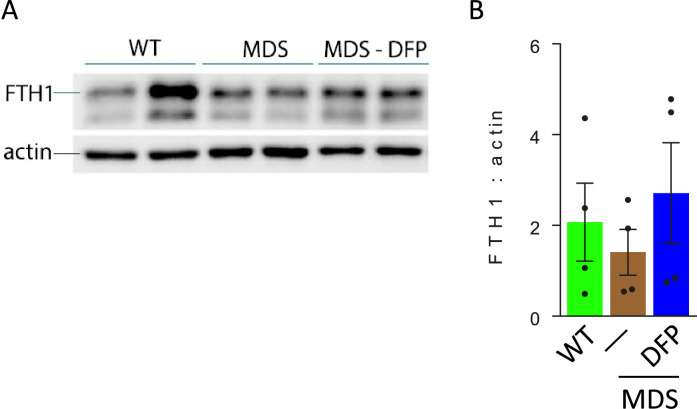
Figure 1—figure supplement 4. Bone marrow erythroblast ferritin is increased in DFP-treated MDS mice.

Figure 1—figure supplement 4.

(A) Western blot of bone marrow CD45 negative cell protein extracts demonstrate no difference in FTH1 between WT, MDS, and DFP-treated MDS mice; the gel is quantified in (B) (n=2 mice/group, experiments repeated twice). WT = wild type; MDS = myelodysplastic syndrome; DFP = deferiprone; FTH1 = ferritin heavy chain. &p<0.05 vs. MDS.
Figure 1—figure supplement 4—source data 1. Western blots with ferritin H antibody staining relative to actin in bone marrow erythroblast enriched CD45 negative cells from wild type (WT), myelodysplastic syndrome (MDS), and DFP-treated MDS mice.
Figure 1—figure supplement 4—source data 2. Source data for quantification of ferritin heavy chain (FTH1) protein concentration relative to actin in bone marrow erythroblast enriched CD45 negative cells from wild type (WT), myelodysplastic syndrome (MDS), and DFP-treated MDS mice.
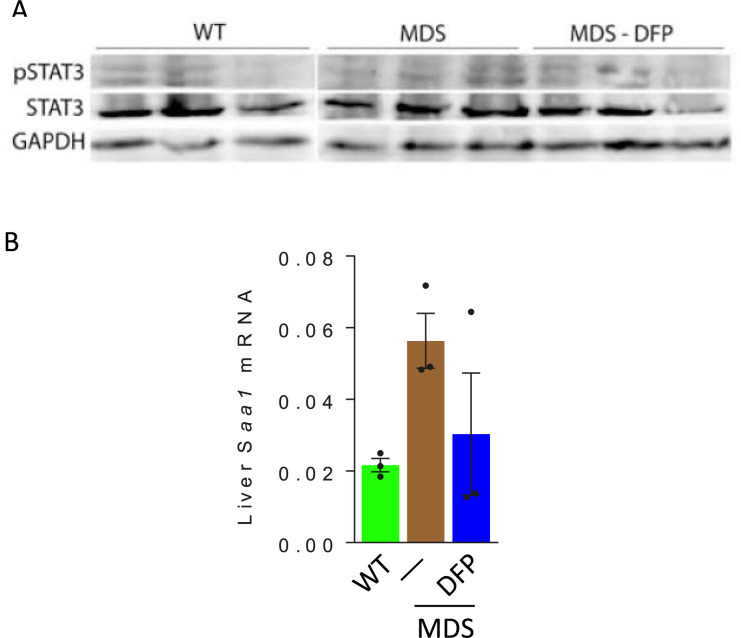
Figure 1—figure supplement 5. Effects of DFP on the liver STAT3 expression in MDS mice.

Figure 1—figure supplement 5.

Western blot of liver protein extracts demonstrate no obvious differences in STAT3 signaling (A), and no differences in Saa1 mRNA expression (B), demonstrating no change in the inflammatory signaling pathway to hepcidin expression between WT, MDS, and DFP-treated MDS mice (n=3 mice/group). WT = wild type; MDS = myelodysplastic syndrome; DFP = deferiprone; pSTAT3=phosphorylated signal transducer and activator of transcription 3; GAPDH = glyceraldehyde 3-phosphate dehydrogenase; Saa1 = serum amyloid A1.
Figure 1—figure supplement 5—source data 1. Western blots with STAT3 and pSTAT3 antibody staining relative to GAPDH in liver from wild type (WT), myelodysplastic syndrome (MDS), and DFP-treated MDS mice.
Figure 1—figure supplement 5—source data 2. Source data for Saa1 in liver from wild type (WT), myelodysplastic syndrome (MDS), and DFP-treated MDS mice.
Figure 1—figure supplement 6. Effect of DFP on erythroblast Erfe expression in WT mice.
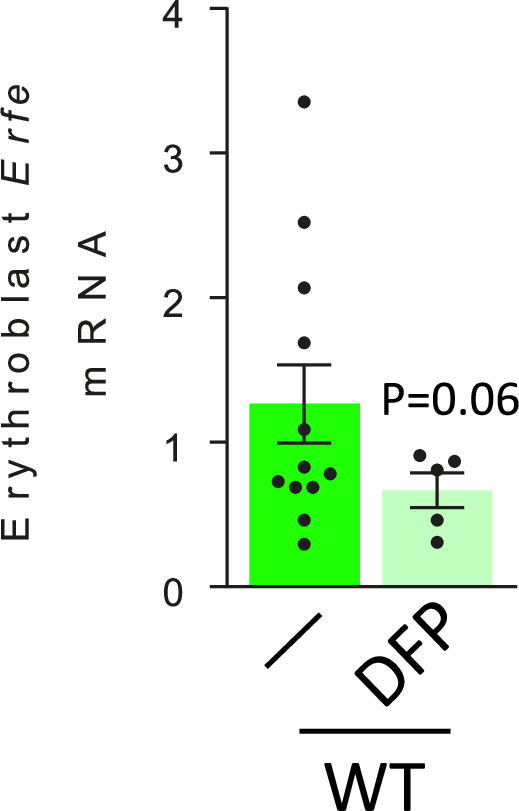
Figure 1—figure supplement 6.

Sorted bone marrow erythroblast Erfe mRNA expression between WT and DFP-treated WT mice (n=5–12 mice/group). *p<0.05 vs. WT DFP; WT = wild type; DFP = deferiprone; Erfe = erythroferrone.
Figure 1—figure supplement 6—source data 1. Source data for erythroferrone (Erfe) in sorted bone marrow erythroblasts from wild type (WT) and DFP-treated WT mice.