. 2023 Dec 28;12:e83103. doi: 10.7554/eLife.83103

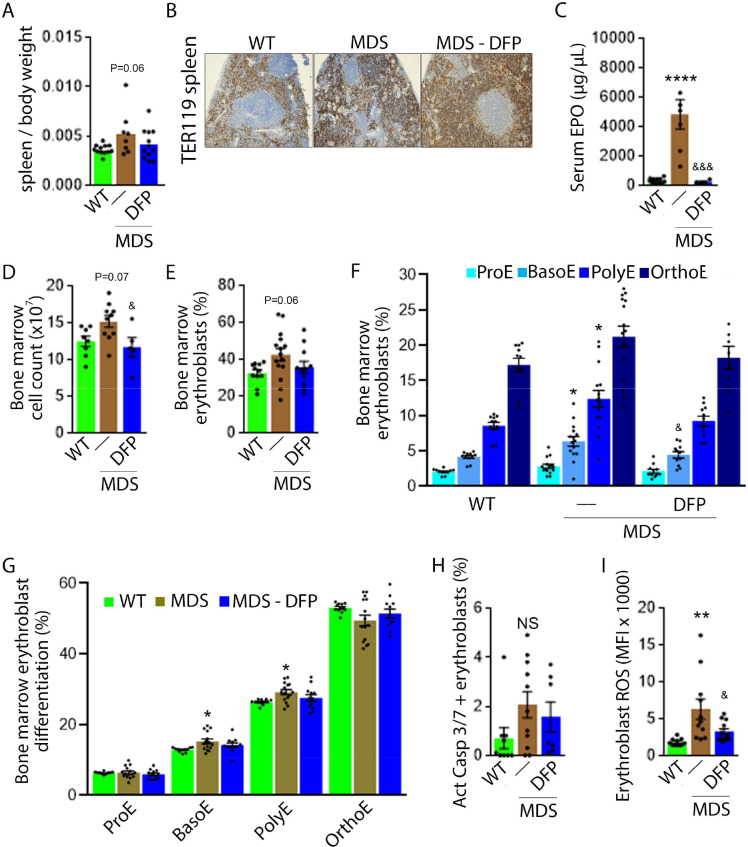
Figure 3. Expanded and ineffective erythropoiesis in MDS mice is partially reversed by DFP.

Spleen weight (n=11–12 mice/group) (A), splenic architecture (n=5 mice/group) (B), serum EPO concentration (n=5–12 mice/group) (C), bone marrow erythroblast count (n=13–15 mice/group) (D), and the total fraction of erythroblasts in the bone marrow (n=13–15 mice/group) (E) are more normal in DFP-treated MDS mice analyzed after 1 month of treatment. The fraction of all stages of terminal erythropoiesis is increased in MDS relative to WT mice in BasoE and PolyE stages and decreased in DFP-treated relative to untreated MDS mice in BasoE stages (n=13–15 mice/group) (F). Erythroblast differentiation in the bone marrow, decreased in MDS relative to WT, is normalized in DFP-treated relative to untreated MDS mice (n=13–15 mice/group) (G). In addition, erythroblast apoptosis, as measured by activated caspase 3/7, is unchanged in DFP-treated MDS mice (n=7–11 mice/group) (H). Finally, erythroblast ROS is decreased in DFP-treated relative to untreated MDS mice (n=11–12 mice/group) (i) analyzed after 1 month of treatment. *p<0.05 vs. WT; **p<0.01 vs. WT; ****p<0.0001 vs. WT; &p<0.05 vs. MDS; &&&p<0.001 vs. MDS; Abbreviations: WT = wild type; MDS = myelodysplastic syndrome; DFP = deferiprone; EPO = erythropoietin; Act casp 3/7 = activated caspase 3 and 7; ROS = reactive oxygen species; ProE = pro-erythroblasts; BasoE = basophilic erythroblasts; PolyE = polychromatophilic erythroblasts; OrthoE = orthochromatophilic erythroblasts; NS = not significant.

Figure 3—source data 1. Source data for erythropoiesis-related parameters in serum, bone marrow, and spleen from wild type (WT), myelodysplastic syndrome (MDS), and DFP-treated MDS mice.

Figure 3.

Figure 3—figure supplement 1. DFP resulted in similar effects on erythropoiesis in male and female myelodysplastic syndrome (MDS) mice.
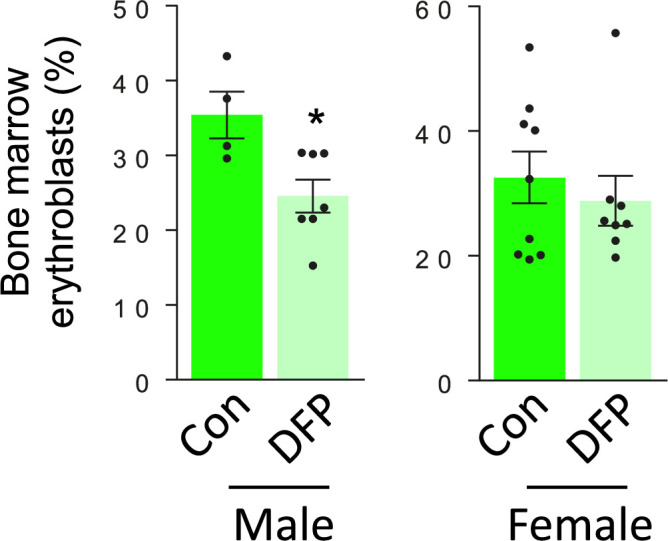
Figure 3—figure supplement 1.

Bone marrow erythroblasts are decreased to a similar degree in male and female DFP-treated MDS mice (n=4–7 male mice/group and n=8–9 female mice/group). *p<0.05 vs. control; Con = control; DFP = deferiprone.
Figure 3—figure supplement 1—source data 1. Source data for bone marrow erythroblasts in male and female myelodysplastic syndrome (MDS) and DFP-treated MDS mice.
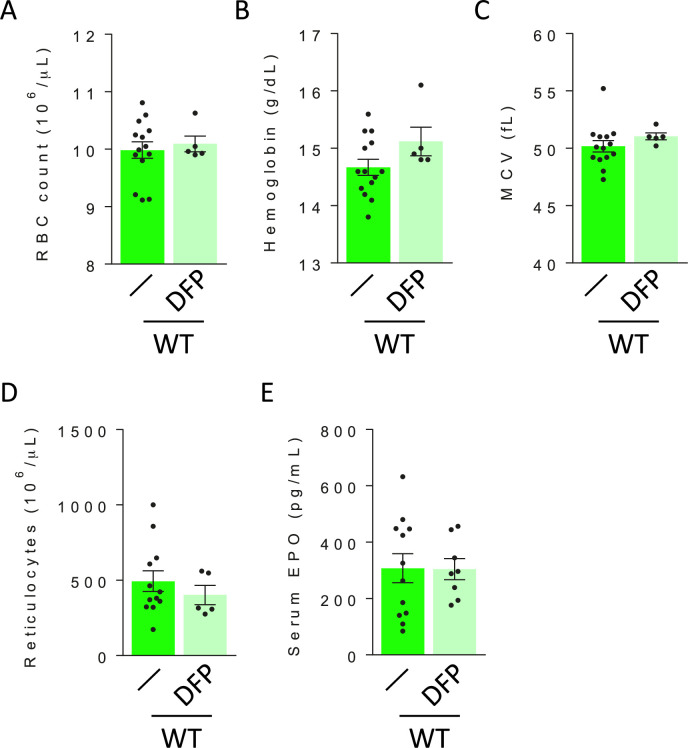
Figure 3—figure supplement 2. DFP has no effect on circulating red blood cell parameters and serum erythropoietin in WT mice.

Figure 3—figure supplement 2.

No differences are observed in RBC count (A), hemoglobin (B), MCV (C), reticulocytes (D), or serum EPO concentration (E) from DFP-treated relative to untreated WT mice (n=5–14 mice/group). WT = wild type; DFP = deferiprone; RBC = red blood cell; MCV = mean corpuscular volume; EPO = erythropoietin.
Figure 3—figure supplement 2—source data 1. Source data for circulating red blood cell parameters and serum erythropoietin from wild type (WT) and DFP-treated WT mice.
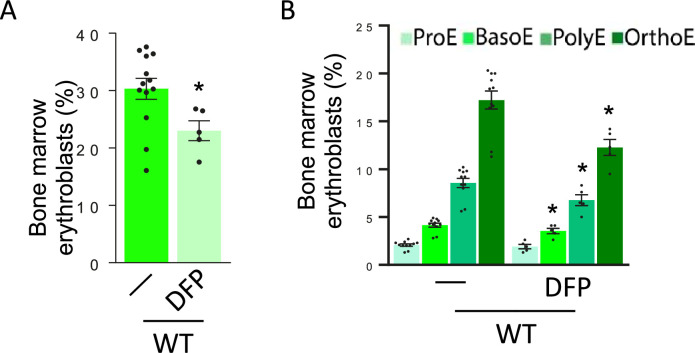
Figure 3—figure supplement 3. Effect of DFP on erythropoiesis in WT mice.

Figure 3—figure supplement 3.

Bone marrow erythroblast fraction (n=5–13 mice/group) significantly decreased (A) particularly as a consequence of fewer BasoE, PolyE, and OrthoE (B) in DFP-treated WT mice (n=5–11 mice/group). *p<0.05 vs. WT; WT = wild type; DFP = deferiprone; ProE = pro-erythroblasts; BasoE = basophilic erythroblasts; PolyE = polychromatophilic erythroblasts; OrthoE = orthochromatophilic erythroblasts.
Figure 3—figure supplement 3—source data 1. Source data for total bone marrow erythroblasts from wild type (WT) and DFP-treated WT mice.
Figure 3—figure supplement 3—source data 2. Source data for bone marrow ProE, BasoE, PolyE, and OrthoE erythroblasts from wild type (WT) and DFP-treated WT mice.
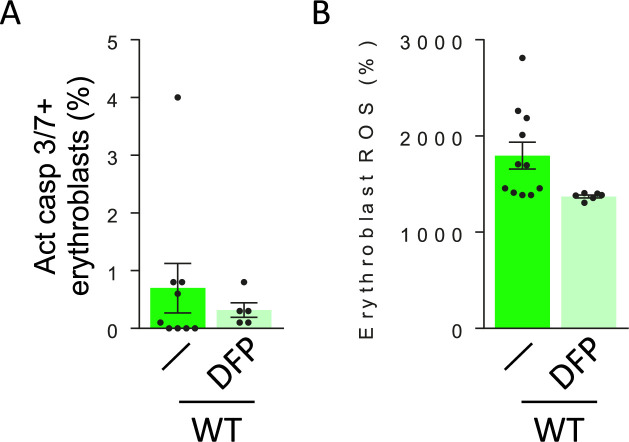
Figure 3—figure supplement 4. DFP has no effect on erythroblast apoptosis and reactive oxygen species in WT mice.

Figure 3—figure supplement 4.

Erythroblast apoptosis, as measured by activated caspase 3 and 7 (n=6–9 mice/group) (A), and ROS (B) are unchanged in DFP-treated relative to untreated WT mice (n=5–9 mice/group). WT = wild type; DFP = deferiprone; Act casp 3/7 = activated caspase 3 and 7; ROS = reactive oxygen species.
Figure 3—figure supplement 4—source data 1. Source data for bone marrow erythroblast apoptosis as measured by activated caspase 3/7 and ROS from wild type (WT) and DFP-treated WT mice.
Figure 3—figure supplement 5. Quantification of serum DFP-glucuronide concentration in DFP-treated WT and MDS mice.
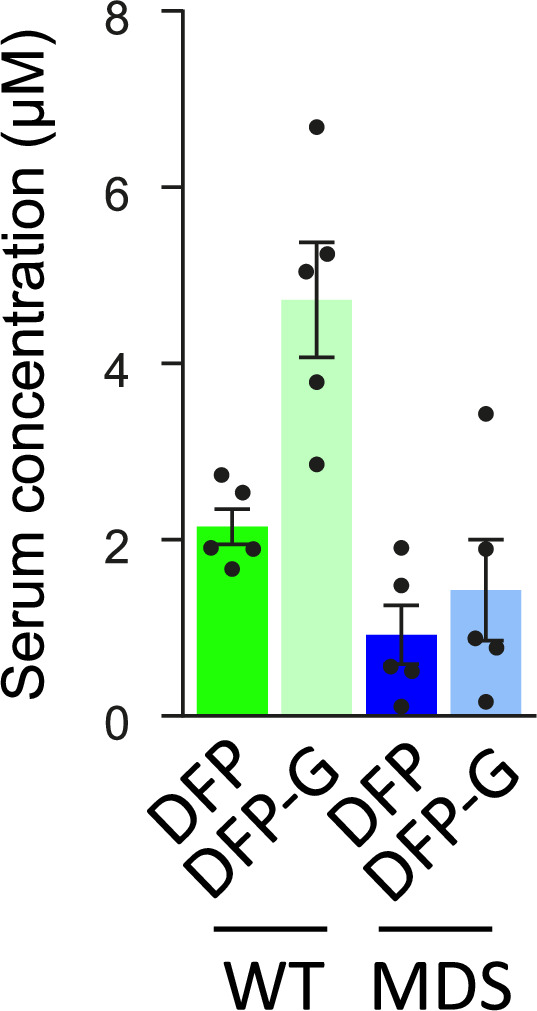
Figure 3—figure supplement 5.

Serum concentration of DFP and of its metabolite, DFP-G, is significantly lower in DFP-treated MDS relative to DFP-treated WT mice (n=5 mice/group). *p<0.05 vs. WT DFP; &&p<0.01 vs. WT DFP-G; WT = wild type; MDS = myelodysplastic syndrome; DFP = deferiprone; DFP-G = DFP-glucuronide.
Figure 3—figure supplement 5—source data 1. Source data for serum DFP and G-DFP concentrations from DFP-treated wild type (WT) and MDS mice.
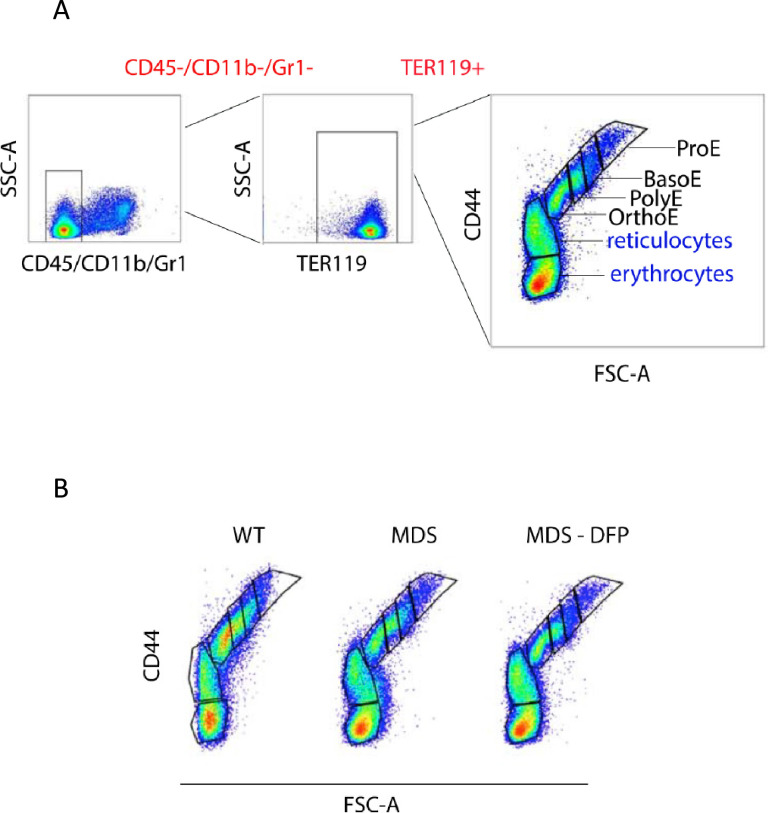
Figure 3—figure supplement 6. Gating strategy for delineating erythroblasts in mouse bone marrow.

Figure 3—figure supplement 6.

Mouse bone marrow is flushed from the femur, processed to remove debris, and filtered to collect CD45 negative flow-through cells. (A) After staining with all required antibodies, CD45-/CD11b-/Gr1- cells are gated (red) and further evaluated using TER119 and side scatter (SSC) to select all TER119 + erythroid lineage cells (red). These cells are then analyzed using forward scatter (FSC) and CD44 to gate pro-erythroblasts (ProE), basophilic erythroblasts (BasoE), polychromatophilic erythroblasts (PolyE), and orthochromatophilic erythroblasts (OrthoE) as progressive stages of terminal erythropoiesis and exclude reticulocytes and enucleated erythrocytes (blue). (B) Terminal erythropoiesis in the bone marrow is evaluated in a homogeneous manner using this gating strategy in WT, MDS, and DFP-treated MDS mice. WT = wild type; MDS = myelodysplastic syndrome; DFP = deferiprone.