. 2023 Dec 28;12:e83103. doi: 10.7554/eLife.83103

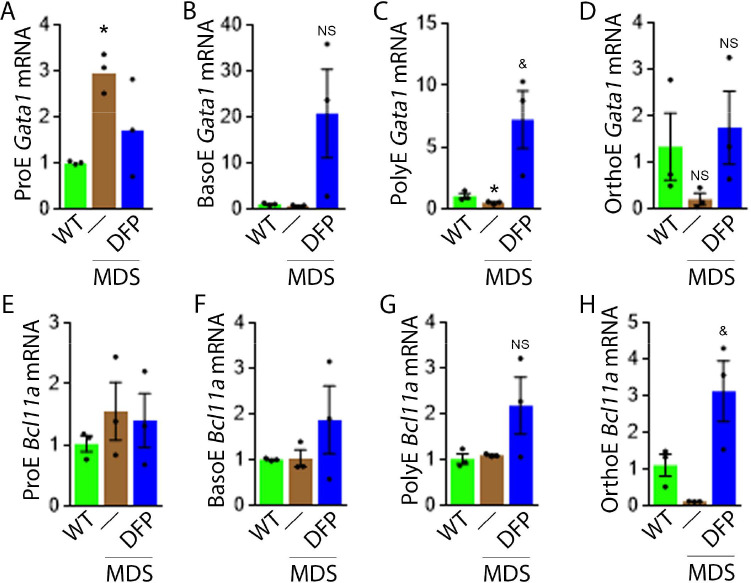
Figure 4. DFP leads to normalized gene expression downstream of EPO in MDS erythroblasts.

Gata1 mRNA expression is increased in sorted bone marrow ProE (A), unchanged in BasoE (B), and significantly decreased in PolyE (C) erythroblasts from MDS relative to WT mice; DFP treatment restores Gata1 mRNA expression relative to untreated MDS or WT mice in all including OrthoE (D) erythroblasts (n=15–21 mice/group). DFP treatment in MDS mice does not affect Bcl11a mRNA expression in sorted bone marrow ProE (E), BasoE (F), and PolyE (G), and increases it in OrthoE (H) erythroblasts relative to untreated MDS or WT mice (n=10–12 mice/group). *p<0.05 vs. WT; &p<0.05 vs. MDS; Abbreviations: WT = wild type; MDS = myelodysplastic syndrome; DFP = deferiprone; Gata1 = erythroid transcription factor; Bcl11a B cell lymphoma 11 a; ProE = pro-erythroblasts; BasoE = basophilic erythroblasts; PolyE = polychromatophilic erythroblasts; OrthoE = orthochromatophilic erythroblasts; NS = not significant.

Figure 4—source data 1. Source data for gene expression downstream of erythropoietin (EPO) in sorted bone marrow erythroblasts from wild type (WT), myelodysplastic syndrome (MDS), and DFP-treated MDS mice.

Figure 4.

Figure 4—figure supplement 1. Effect of DFP on erythroblast Bcl11a expression in WT mice.
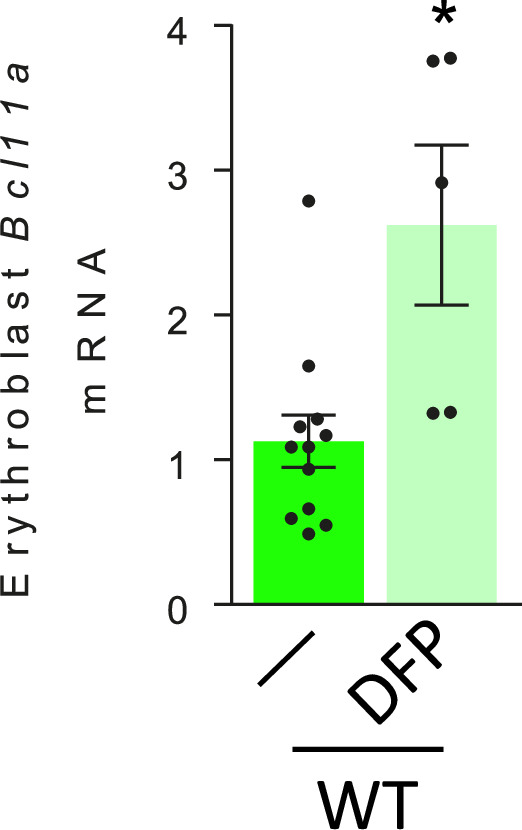
Figure 4—figure supplement 1.

Sorted bone marrow erythroblast Bcl11a mRNA expression between WT and DFP-treated WT mice (n=5–12 mice/group). *p<0.05 vs. WT DFP; WT = wild type; DFP = deferiprone; Bcl11a = B cell lymphoma 11 a, gene name for Bcl-XL.
Figure 4—figure supplement 1—source data 1. Source data for B cell lymphoma (Bcl11a) in sorted bone marrow erythroblasts from wild type (WT) and DFP-treated WT mice.
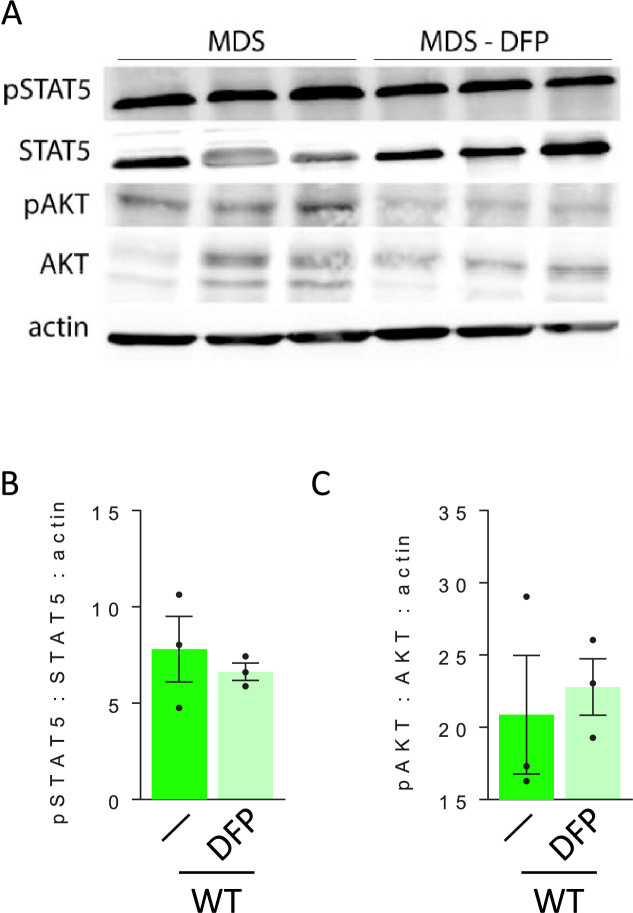
Figure 4—figure supplement 2. Nuances of signaling downstream of erythropoietin (EPO) in bone marrow erythroblasts from MDS and DFP-treated MDS mice.

Figure 4—figure supplement 2.

(A) Western blot of bone marrow CD45 negative cell protein extracts demonstrate no differences in STAT5 signaling between untreated and DFP-treated MDS mice, quantified in (B). Similarly, AKT signaling is not altered in DFP-treated MDS mice, quantified in (C), demonstrating no change in these signaling pathways in response to DFP in MDS mice (n=3 mice/group). MDS = myelodysplastic syndrome; DFP = deferiprone; pSTAT5=phosphorylated signal transducer and activator of transcription 5; pAKT = phosphorylated protein kinase B.
Figure 4—figure supplement 2—source data 1. Western blots with pSTAT5, STAT5, pAKT, and AKT antibody staining relative to actin in bone marrow erythroblast-enriched CD45 negative cells from myelodysplastic syndrome (MDS) and DFP-treated MDS mice.
Figure 4—figure supplement 2—source data 2. Source data for quantification of signaling via STAT5 and AKT in bone marrow erythroblast-enriched CD45 negative cells from myelodysplastic syndrome (MDS) and DFP-treated MDS mice.