. 2023 Dec 28;12:e83103. doi: 10.7554/eLife.83103

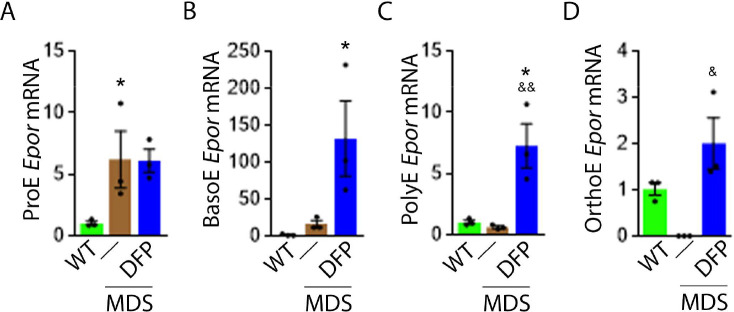
Figure 5. DFP increases Epor expression in MDS erythroblasts.

DFP treatment in MDS mice increases Epor mRNA expression in sorted bone marrow following ProE (A), namely in BasoE (B), PolyE (C), and OrthoE (D) erythroblasts relative to untreated MDS or WT mice. *p<0.05 vs. WT; &p<0.05 vs. MDS; &&p<0.01 vs. MDS. Abbreviations: WT = wild type; MDS = myelodysplastic syndrome; DFP = deferiprone; Epor = erythropoietin receptor; ProE = pro-erythroblasts; BasoE = basophilic erythroblasts; PolyE = polychromatophilic erythroblasts; OrthoE = orthochromatophilic erythroblasts.

Figure 5—source data 1. Source data for erythropoietin receptor (Epor) in sorted bone marrow erythroblasts from wild type (WT), myelodysplastic syndrome (MDS), and DFP-treated MDS mice.

Figure 5.

Figure 5—figure supplement 1. Effect of DFP on erythroblast Epor expression in WT mice.
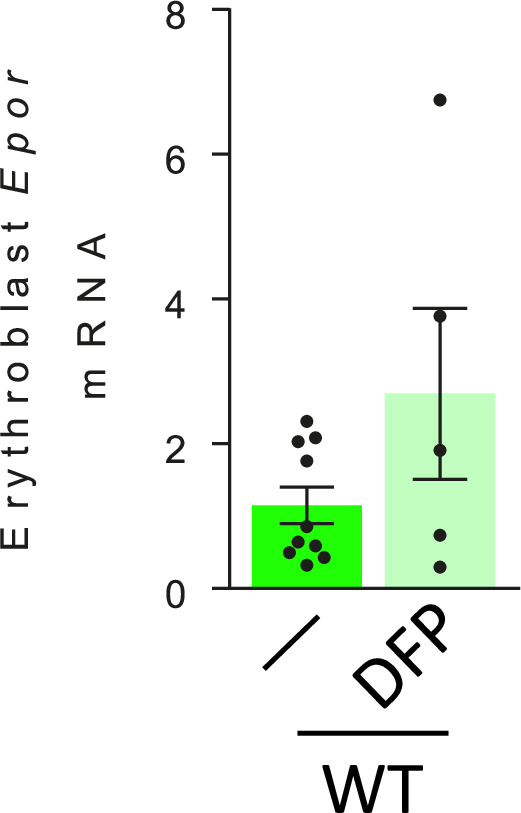
Figure 5—figure supplement 1.

Sorted bone marrow erythroblast Epor mRNA expression between WT and DFP-treated WT mice (n=5–10 mice/group). *<0.05 vs. WT DFP; WT = wild type; DFP = deferiprone; Epor = erythropoietin receptor.
Figure 5—figure supplement 1—source data 1. Source data for erythropoietin receptor (Epor) in sorted bone marrow erythroblasts from wild type (WT) and DFP-treated WT mice.
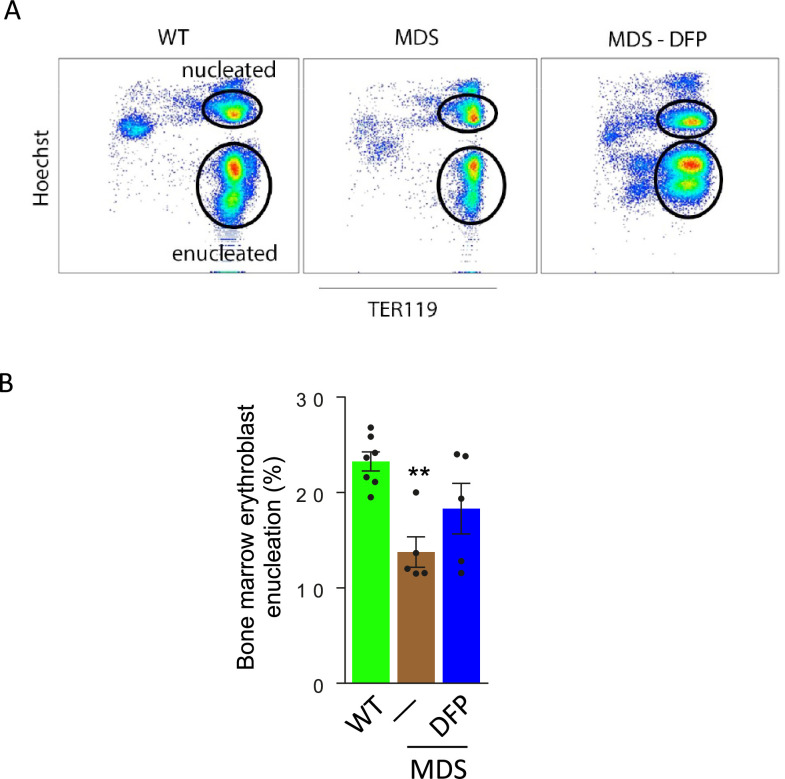
Figure 5—figure supplement 2. Defective enucleation in MDS erythroblasts is normalized by DFP.

Figure 5—figure supplement 2.

(A) DFP restores erythroblast enucleation (n=5–7 mice/group) in MDS mouse bone marrow, quantified in (B) as the fraction of enucleated relative to the total of nucleated and enucleated erythroblasts, using Hoechst staining in TER119 positive cells. **p<0.01 vs. WT; Abbreviations: WT = wild type; MDS = myelodysplastic syndrome; DFP = deferiprone.
Figure 5—figure supplement 2—source data 1. Source data for flow analysis of enucleation in erythroblasts from wild type (WT), myelodysplastic syndrome (MDS), and DFP-treated MDS mice.