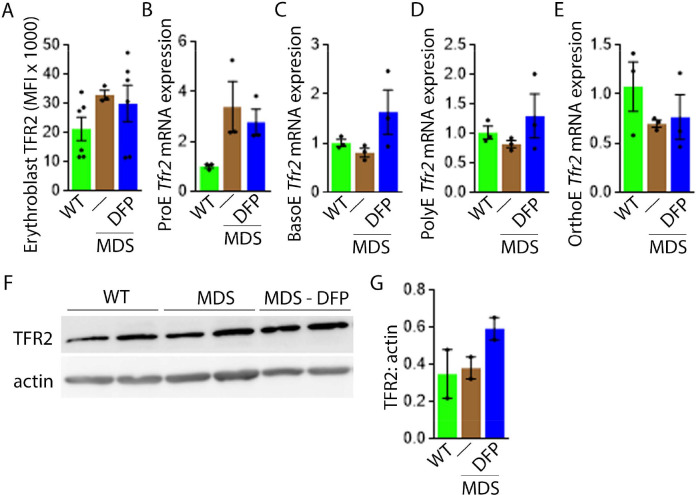
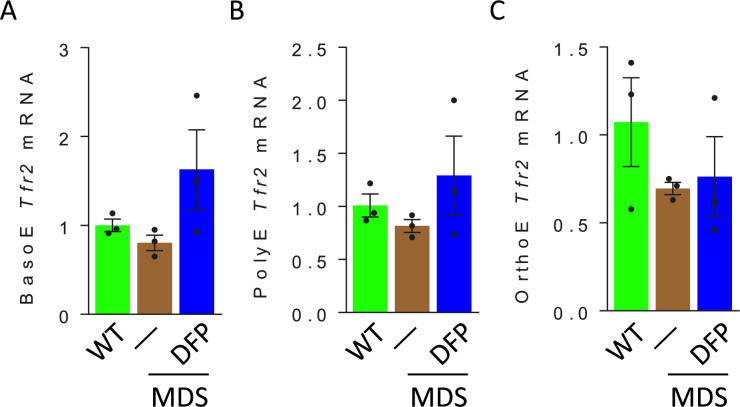
Figure 7. DFP does not normalize elevated TFR2 expression in MDS erythroblasts.
(A) Flow cytometry gating using TER119 and CD44 was used to delineate bone marrow erythroblasts. In these gated erythroblasts, we evaluate membrane TFR2 which is unchanged in MDS and DFP-treated MDS mice (n=6–7 mice/group) analyzed after 1 month of treatment. (B) TFR2 mRNA expression is borderline increased in sorted bone marrow ProE from MDS relative to WT mice and remains significantly elevated in DFP-treated MDS relative to WT mice (n=15–18 mice/group). When compared with sorted bone marrow ProE, TFR2 expression in sorted bone marrow BasoE (C), PolyE (D), and OrthoE (E) is significantly suppressed in MDS relative to WT mice and remains suppressed in PolyE and OrthoE from DFP-treated MDS mice (n=15–18 mice/group). (F) Western blot demonstrating TFR2 protein concentration in bone marrow erythroblasts is not different between WT, MDS, and DFP-treated MDS mice, quantified in (G) (n=3 mice/sample). *p<0.05 vs. WT; **p<0.01 vs. WT; Abbreviations: WT = wild type; MDS = myelodysplastic syndrome; DFP = deferiprone; TFR2 = transferrin receptor 2; ProE = pro-erythroblasts; BasoE = basophilic erythroblasts; PolyE = polychromatophilic erythroblasts; OrthoE = orthochromatophilic erythroblasts.


