. 2023 Dec 28;12:e83103. doi: 10.7554/eLife.83103

Figure 8. DFP alters the expression of iron chaperones in MDS erythroblasts.

Sorted bone marrow Pcbp1 mRNA expression is increased in ProE (A) from MDS relative to WT mice and remains high or is further elevated in ProE, BasoE (B), and PolyE (C) DFP-treated relative to untreated MDS mice. (D) Sorted bone marrow Pcbp1 mRNA expression is unchanged in OrthoE from MDS relative to WT mice, borderline normalized in DFP-treated MDS mice. Sorted bone marrow mRNA expression of Ncoa4 in ProE (E) is borderline increased in MDS, normalized in DFP-treated MDS mice. Sorted bone marrow mRNA expression of Ncoa4 is unchanged in BasoE (F) and PolyE (G) from MDS or DFP-treated MDS relative to WT mice. Sorted bone marrow mRNA expression of Ncoa4 in OrthoE (H) is unchanged in MDS and normalized in DFP-treated MDS mice (n=15–18 mice/group). *p<0.05 vs. WT; &p<0.05 vs. MDS; Abbreviations: WT = wild type; MDS = myelodysplastic syndrome; DFP = deferiprone; Pcbp1=Poly(rC)-binding protein 1; Ncoa4=nuclear receptor coactivator 4; ProE = pro-erythroblasts; BasoE = basophilic erythroblasts; PolyE = polychromatophilic erythroblasts; OrthoE = orthochromatophilic erythroblasts.

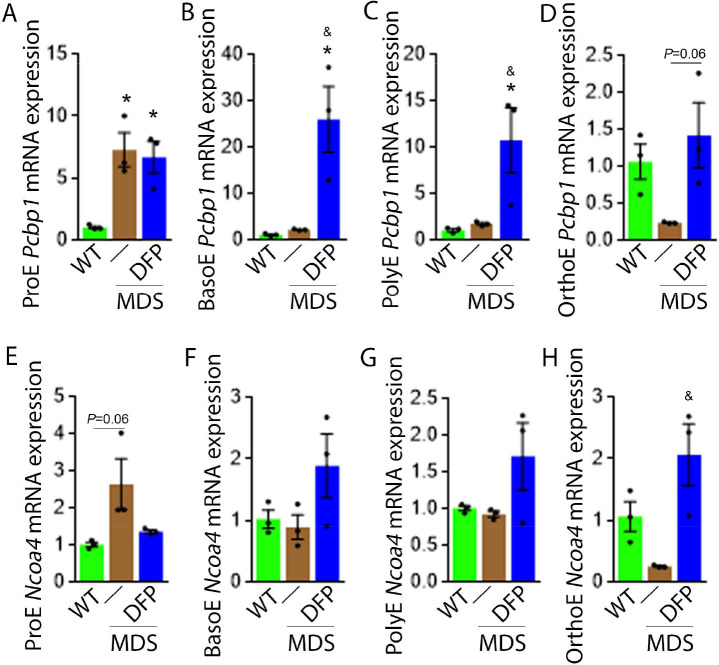
Figure 8—source data 1. Source data for Pcbp1 and Ncoa4 in sorted bone marrow erythroblasts from wild type (WT), myelodysplastic syndrome (MDS), and DFP-treated MDS mice.

Figure 8.

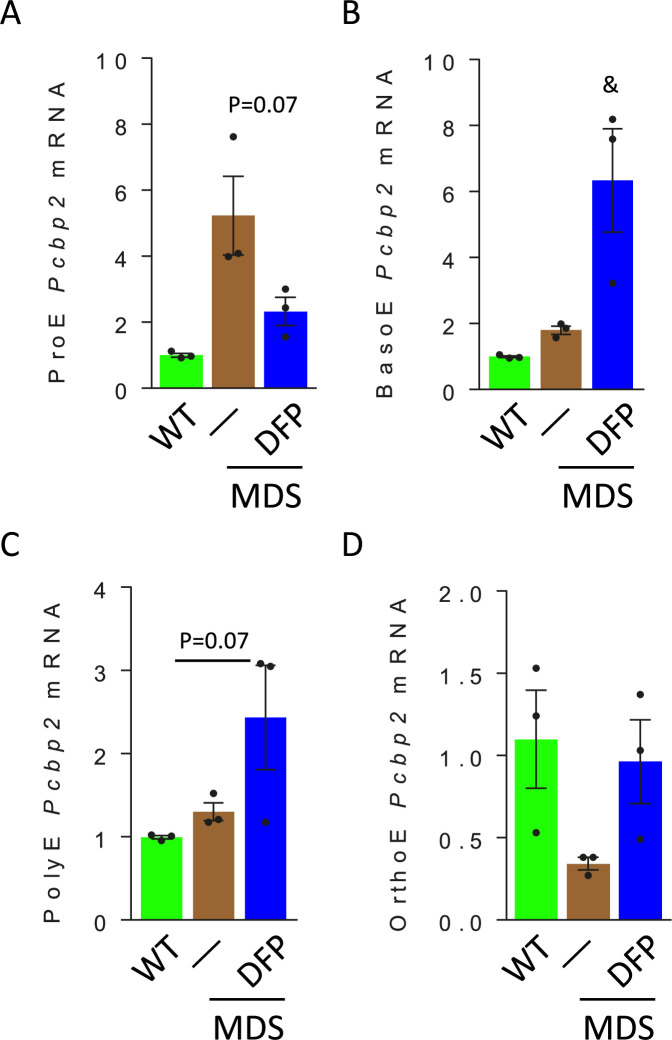
Figure 8—figure supplement 1. Erythroblast Pcbp2 mRNA expression in WT, MDS, and DFP-treated MDS mice.

Figure 8—figure supplement 1.

Pcbp2 mRNA expression changes parallel those of Pcbp1 in sorted bone marrow ProE (A), BasoE (B), PolyE (C), and OrthoE (d) between WT, MDS, and DFP-treated MDS mice (n=15–18 mice / group). *p<0.05 vs. WT; &p<0.05 vs. MDS; WT = wild type; MDS = myelodysplastic syndrome; DFP = deferiprone; ProE = pro-erythroblasts; BasoE = basophilic erythroblasts; PolyE = polychromatophilic erythroblasts; OrthoE = orthochromatophilic erythroblasts; Pcbp2=Poly(rC)-binding protein 2.
Figure 8—figure supplement 1—source data 1. Source data for Pcbp2 in sorted bone marrow erythroblasts from wild type (WT), myelodysplastic syndrome (MDS), and DFP-treated MDS mice.
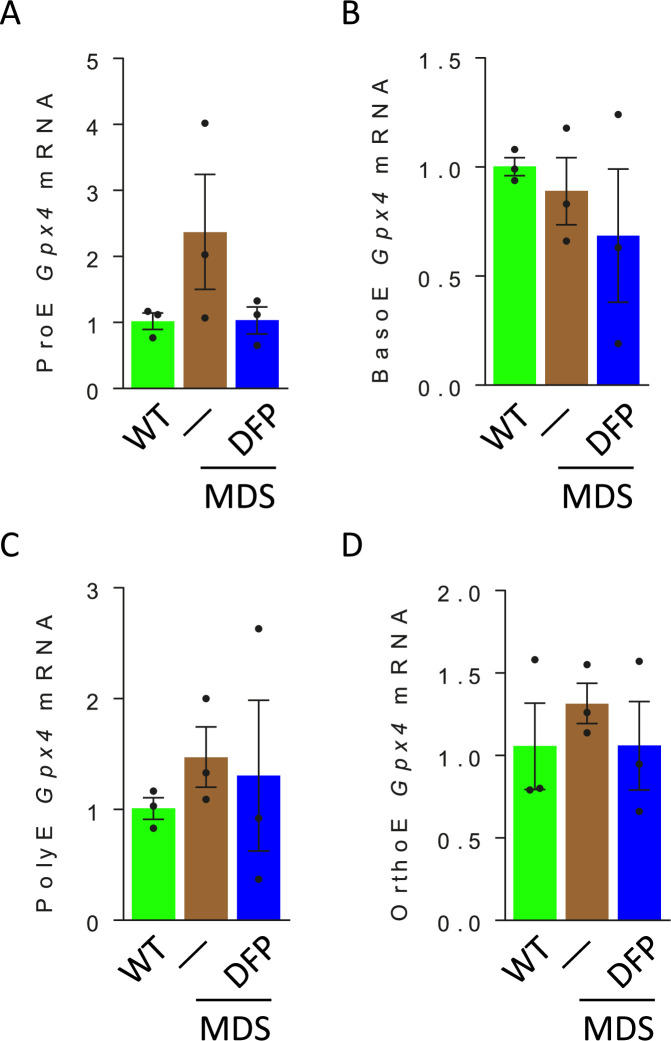
Figure 8—figure supplement 2. Erythroblast Gpx4 mRNA expression in WT, MDS, and DFP-treated MDS mice.

Figure 8—figure supplement 2.

No differences in Gpx4 mRNA expression are observed in sorted bone marrow ProE (A), BasoE (B), PolyE (C), and OrthoE (D) between WT, MDS, and DFP-treated MDS mice (n=15–18 mice/group). WT = wild type; MDS = myelodysplastic syndrome; DFP = deferiprone; ProE = pro-erythroblasts; BasoE = basophilic erythroblasts; PolyE = polychromatophilic erythroblasts; OrthoE = orthochromatophilic erythroblasts; GPX4 = glutathione peroxidase 4.
Figure 8—figure supplement 2—source data 1. Source data for glutathione peroxidase 4 (Gpx4) in sorted bone marrow erythroblasts from wild type (WT), myelodysplastic syndrome (MDS), and DFP-treated MDS mice.