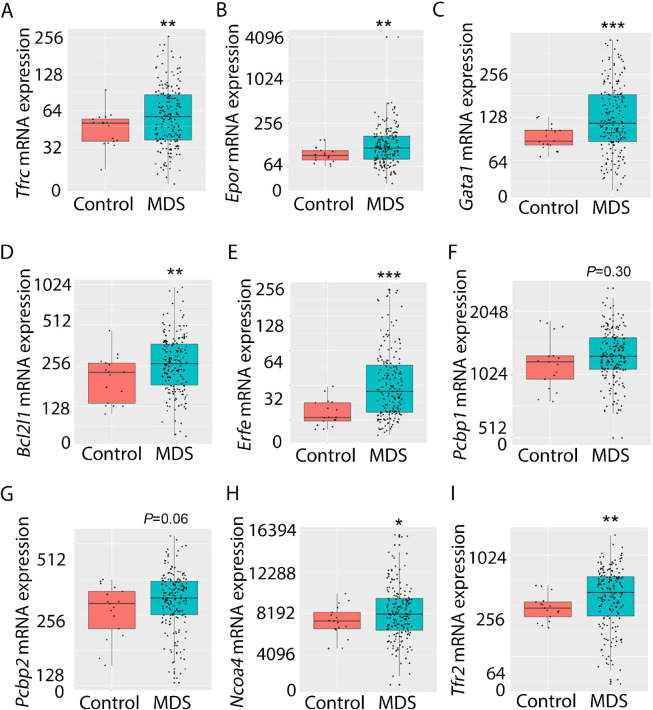
Figure 9. Increased expression of iron metabolism-related genes in MDS patient bone marrow stem and progenitor cells.
Increased expression of Tfrc (A), Epor (B), Gata1 (C), Bcl2l1 (D), and Erfe (E) is expected and validates the database. No difference in Pcbp1 (F), borderline increase in Pcbp2 (G), and statistically significantly increase in Ncoa4 (H) and TFR2 (I) are evident in MDS patients relative to controls, providing an important confirmation of the relevance of similar findings in MDS mice. *p<0.05, **p<0.01, ***p<0.0001 vs. control; MDS = myelodysplastic syndrome; Tfrc and TFR2 = transferrin receptor 1 and 2; Epor = erythropoietin receptor; Bcl2l1 = B cell lymphoma 2-like protein 1 (gene name for Bcl-Xl); Erfe = erythroferrone; Pcbp1 and Pcbp2 = Poly(rC)-binding protein 1 and 2; Ncoa4 nuclear receptor coactivator 4.

