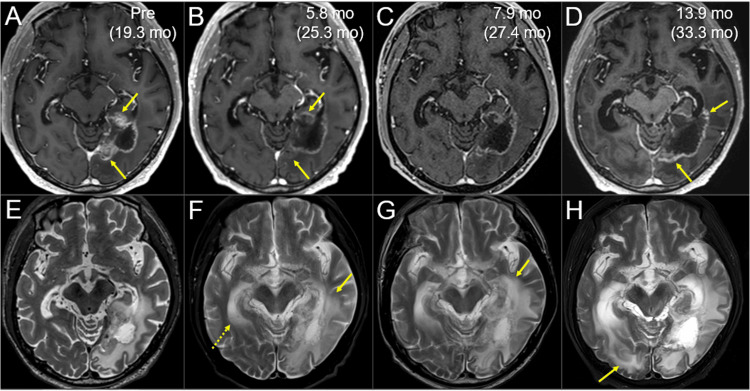
Figure 7. Magnetic resonance images before and after the re-radiosurgery, focusing on the local control of the regrowth lesions.
The images show (A-D) axial CE T1-WIs; (E-G) axial T2-WIs; (A, E) five days before the re-SRS (19.3 months [mo] after the initial SRS); (B, F) at 5.8 months after the initiation of re-SRS (25.3 months after the initial SRS); (C, G) at 7.9 months (27.4 months) and (D, H) at 13.9 months (33.3 months).
(A-H) These images are shown at the same magnification and coordinates under co-registration and fusion based on the pre-SRS images. (A, B, E, F) The regrowth lesions (arrows in A) regressed substantially at 5.8 months (arrows in B), while the perilesional edema aggravated (arrow in F), and the temporal horn of the contralateral lateral ventricle enlarged (dashed arrow in F). (C, G) At 7.9 months, the regrowth lesions remained regressed, while the perilesional edema further increased (arrow in G). (D, H) At 13.9 months, the marginally enhancing lesion expanded (arrows in D), suggesting dominance of brain radionecrosis, along with aggravation of the perilesional edema (arrow in H).
CE: contrast-enhanced; WI: weighted image; SRS: stereotactic radiosurgery; mo: months

