Figure 1.
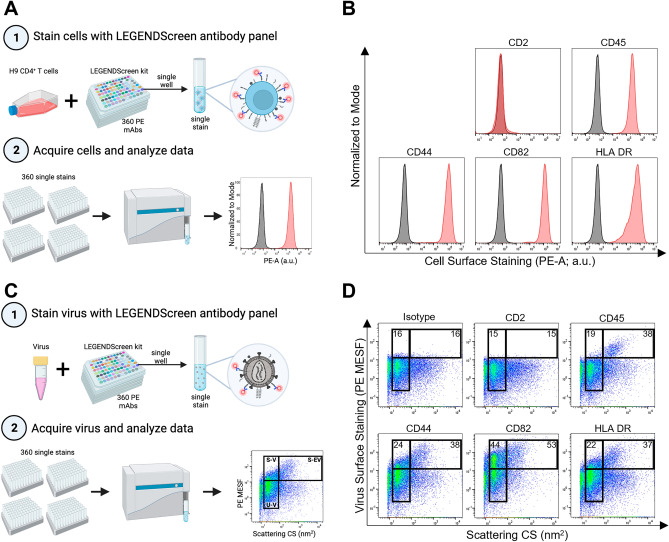
Adapting the LEGENDScreen kit for use on HIVIIIB and its producer cells. (A) Schematic depicting the experimental workflow used for cell staining. Step 1 shows infected H9 cells stained with 360 unique PE-labelled antibodies provided in the LEGENDScreen kit, which consists of four 96-well plates containing a single PE-labelled mAb clone in each well (different clones depicted as different colors). Each well was harvested into a single tube, as a single stain to be acquired in step 2. Step 2 shows stained cells acquired on the CytoFLEX nanoscale cytometer by flow cytometry methods. Data are displayed as fluorescence histograms with isotype staining shown in black and specific protein staining shown in red. (B) A representative subset of cell surface staining from the LEGENDScreen. (C) Schematic depicting the experimental workflow used for virus staining. Step 1 shows virus (HIVIIIB) produced in H9 cells that was stained with the LEGENDScreen antibodies and then transferred to tubes and diluted in PBS before proceeding to step 2 for acquisition. Data are displayed in pseudocolour dot plots to allow for the visualization of virus and vesicle populations. The lower gate denotes unstained virus (U-V). The left and right upper gates display stained virus (S-V) and stained extracellular vesicles (S-EV), respectively. (D) A representative subset of virus surface staining from the LEGENDScreen, with mean PE MESF values depicted in the gates, as shown. Data from one screen performed on the H9 cells and their respective viruses are shown.

