Figure 3.
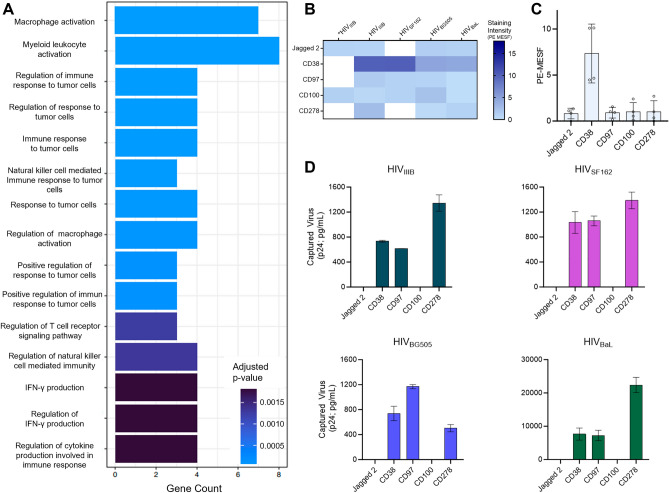
Characterizing novel virion-incorporated candidate proteins identified from the flow virometry screen. (A) Purported biological processes of the novel candidates from the LEGENDScreen as described through gene ontology analysis. Novel candidates were defined as proteins that have not been described in the literature on HIV, and those that stained above isotype on at least three out of four PBMC viruses tested. (B) A subset of novel candidate proteins identified through the LEGENDScreen. Each row represents a different antibody stain from the LEGENDScreen panel, and each column represents a different viral isolate. *Staining intensities from HIVIIIB produced in the H9 T cell line are shown in column one. Staining intensities for proteins of interest were subtracted from the mean staining values generated from staining with matched isotype controls. Samples with staining below the isotype control are shown in white. (C) Graphical representation of the PE MESF values observed in B for the selected novel proteins. Each dot represents a different viral isolate that was tested in the LEGENDScreen. Bars represent the mean PE MESF value ± standard deviation. MESF values with fluorescent intensity below the isotype controls were plotted at zero. (D) Virion capture assays were performed to corroborate the presence of the selected novel protein candidates on the viruses. Normalized inputs of the same virus stocks tested in the LEGENDScreen assays (HIVBaL, HIVIIIB, HIVBG505, HIVSF162) were incubated with plate-bound mAbs against Jagged 2, CD38, CD97, CD100, and CD278/ICOS. Captured virions were lysed and HIV Gag (p24) was quantified in the lysates (via AlphaLISA), as an indicator of the amount of virus capture. Values are representative of two independent experiments and are reported as the mean ± SD of duplicate AlphaLISA measurements. CD38, CD97, and CD278/ICOS were significantly higher than isotype capture (paired ANOVA; p = 0.001) across all four virus isolates. Virus capture values that were below the isotype control are shown as zero.

