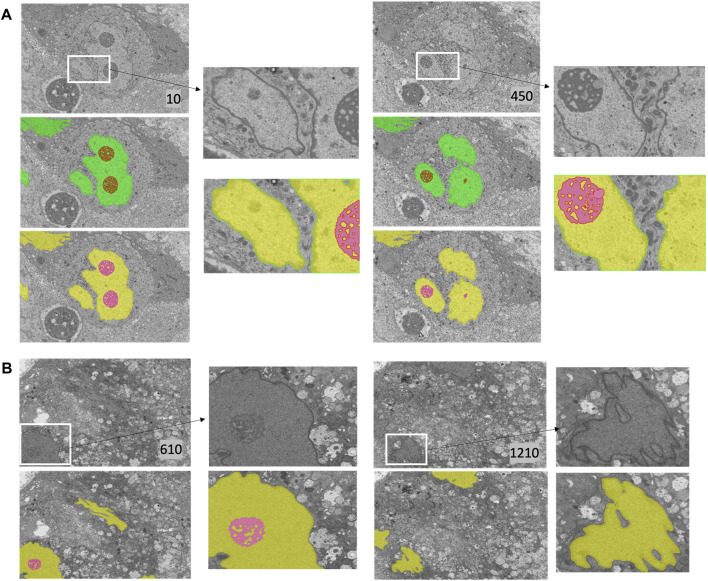
FIGURE 5.
Nucleus and nucleolus segmentation results on PTT and Bx4 datasets. (A) Representative qualitative results showing input images (top row) overlaid with nucleus (green) and nucleolus (red) ground truth masks (middle row) and predicted nucleus (yellow) and nucleolus (pink) segmentation masks (bottom row) for the PTT dataset. (B) Representative qualitative results showing input images (top row) overlaid with predicted nucleus (yellow) and nucleolus (pink) segmentation masks (bottom row) for the Bx4 dataset. All 19 slices from the Bx4 dataset that had nucleolus labels were employed in the training of ResUNet, resulting in the possibility of conducting only a qualitative comparison. Numbers in the lower right-hand corner of images indicate the slice position of the image in the full image stack. Scale: horizontal image width = 25 μm.

