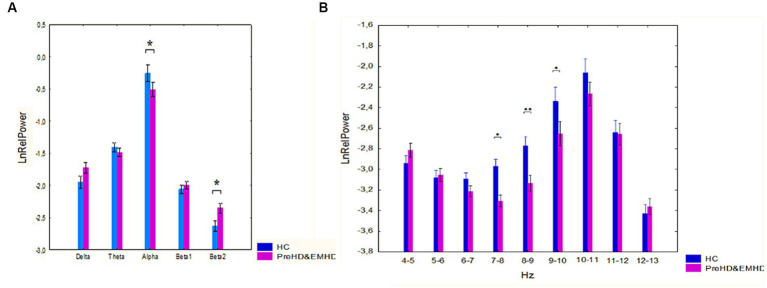
Figure 1.
Log-transformed relative power of EEG bands (mean and standard error [SE]) in individuals with HTT mutations, including those with PreHD and EMHD, and the control group of healthy individuals (HC). (A) Standard broad frequency bands. (B) Every 1-Hz subband of theta and alpha bands. * p < 0.05, **p < 0.01: Significant differences in relative power of EEG frequency bands or subbands between the HTT mutations carriers and healthy individuals.

