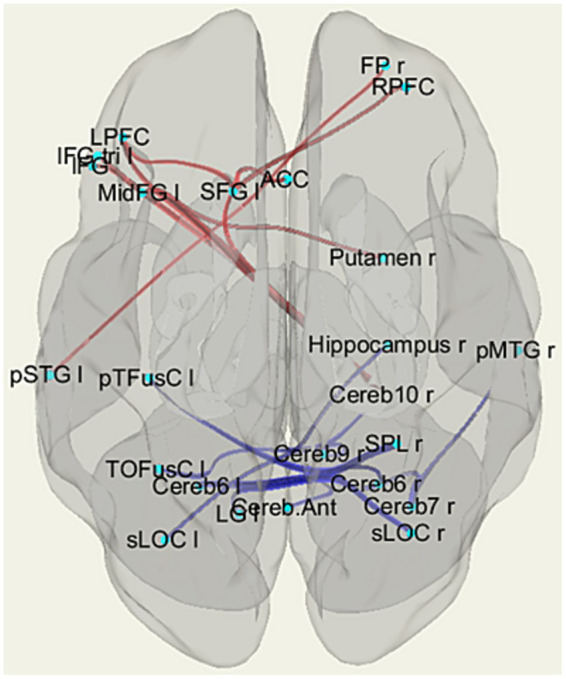
Figure 3.

The patterns of functional links corresponding to the differences in fMRI resting-state functional connectivity (rsFC) among the individuals with HTT mutations, including those with PreHD and EMHD, and the control group of healthy individuals (p-FDR < 0.05). Abbreviations are the same as in Table 3.
