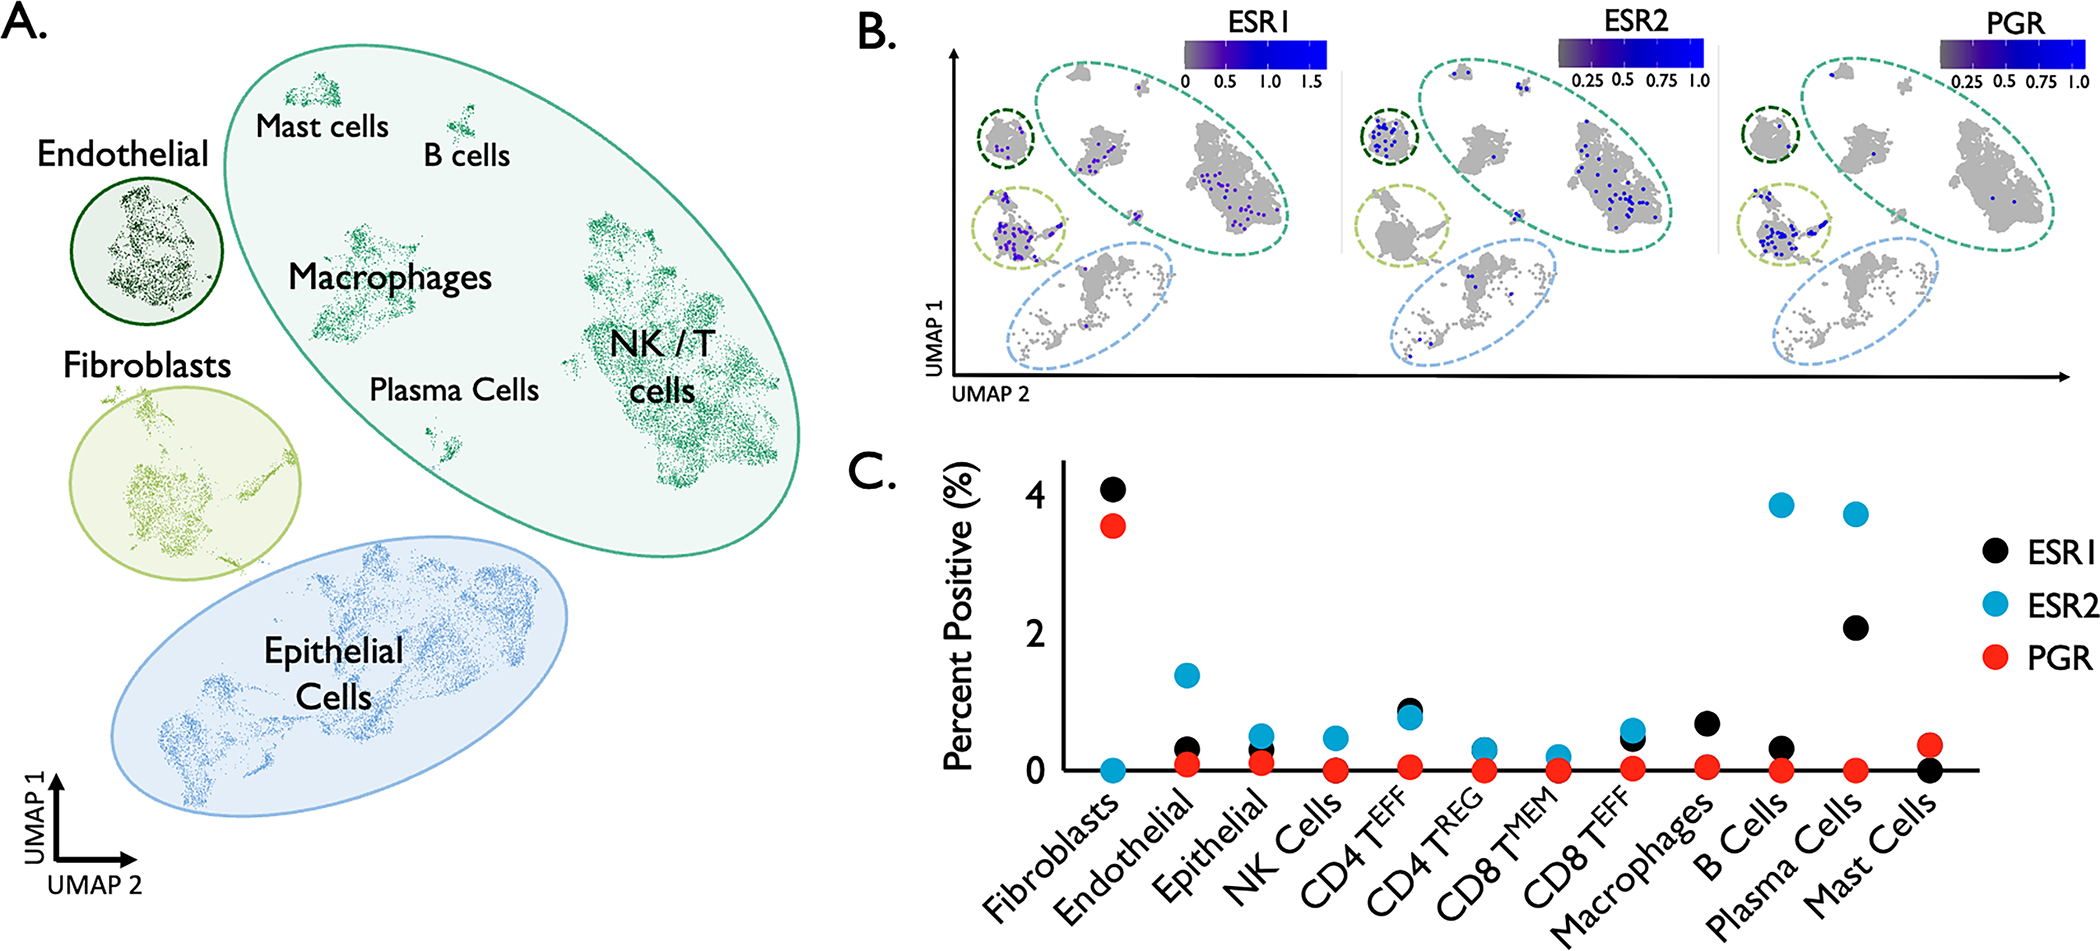
Figure 2. Cell identification and characterization in iSGS.

(A) UMAP of jointly analyzed single-cell transcriptomes from 25,974 cells from 7 iSGS mucosal scar and 3 healthy mucosa annotated by cell type. Cell subsets manually grouped into 4 broad tissue classes (Immune/Epithelial/Endothelial/Mesenchymal). (B) UMAP highlighting the differential gene expression of ESR1, ESR2, and PGR among the different cell type/states in iSGS airway scar. Blue dots indicate expression; color intensity denotes level of gene expression. (C) Graph depicting the percent positivity of expressed hormone receptors for each cell type in iSGS tissue. For cell types with multiple subsets, the average percent positivity is represented. Black dots = ESR1; Blue dots = ESR2; Red dots = PR.
