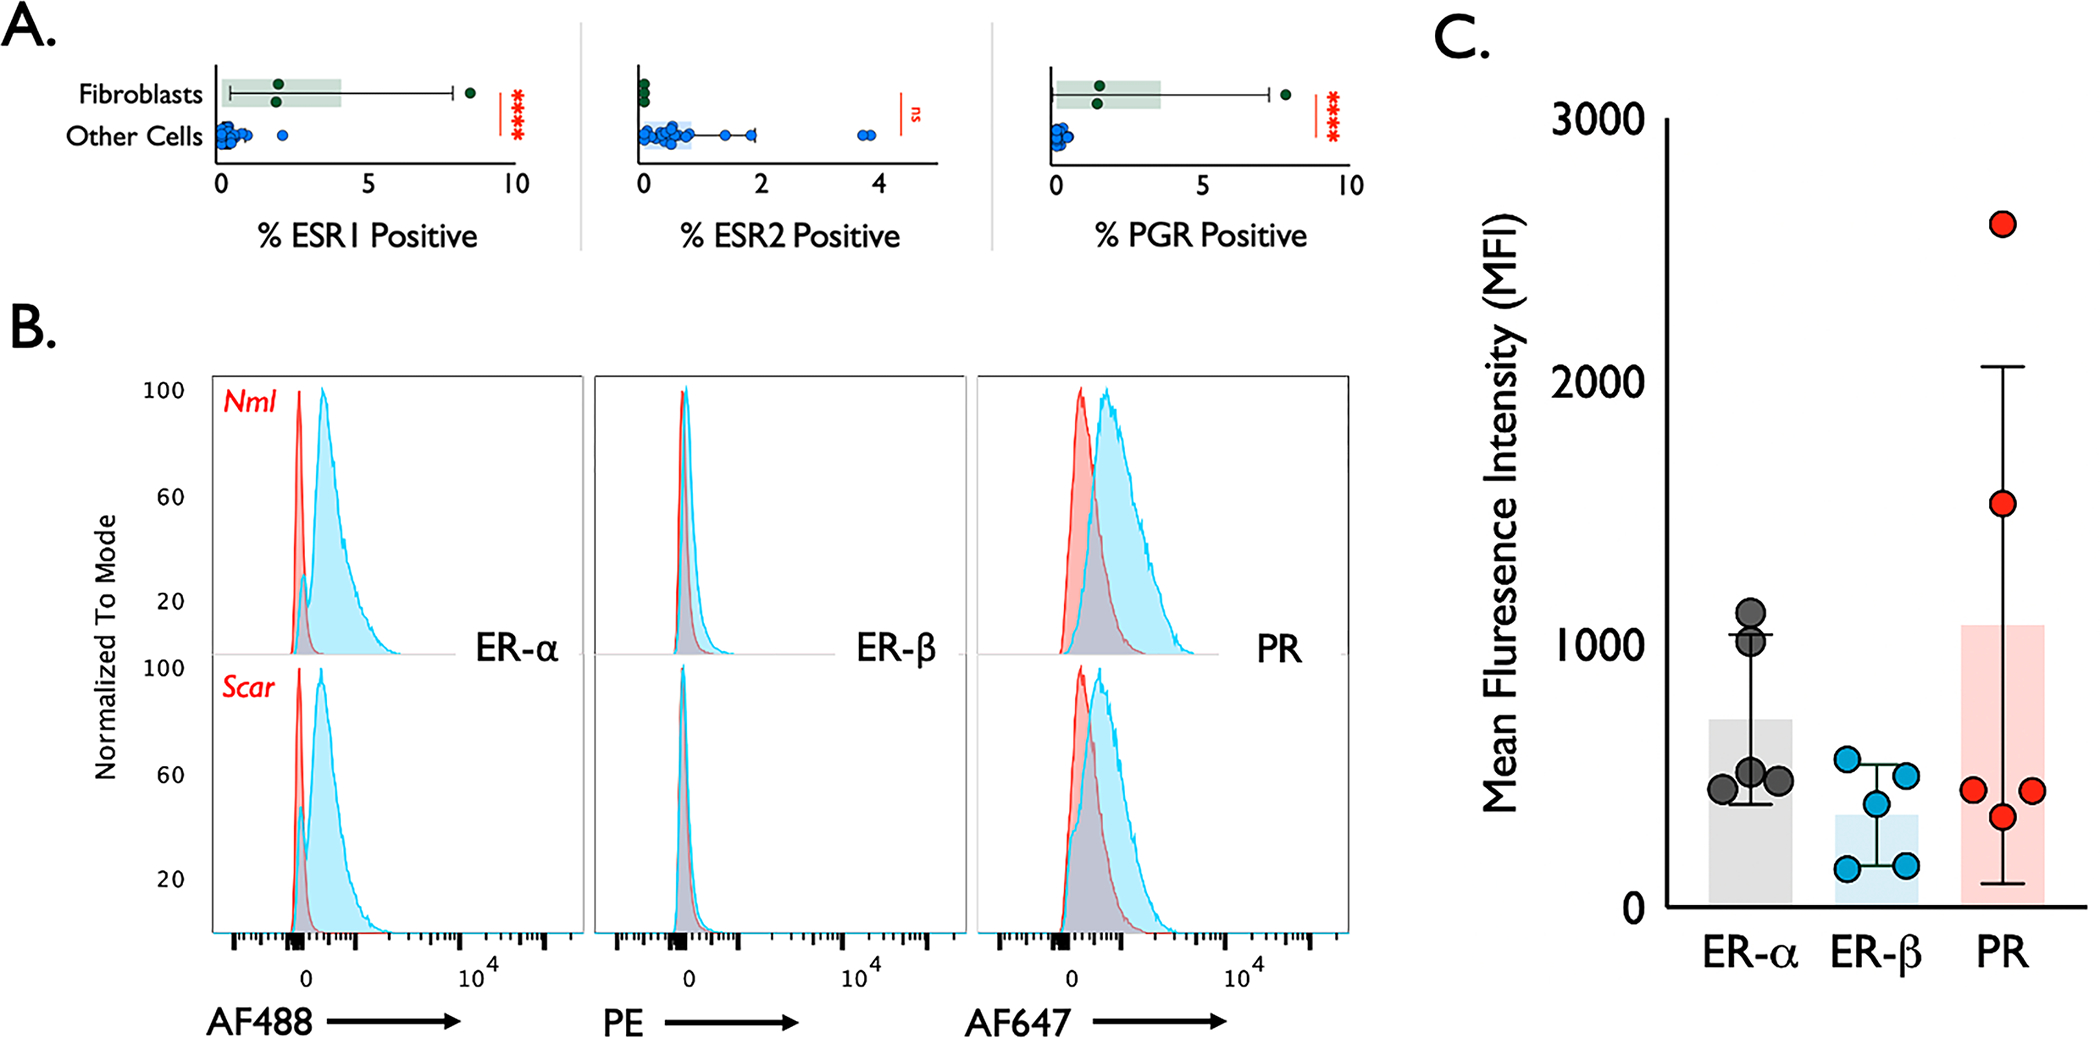
Figure 3. iSGS fibroblast expression of ER and PR.

(A) Differential gene expression of hormone receptors in fibroblasts compared to other cells in iSGS patients as determined by scRNAseq. iSGS fibroblasts showed significantly increased ESR1 and PGR expression (both P < 0.001), while demonstrating no ESR2 expression. Bar represents mean; error bars represent SEM; dots show individual patients. ****P < 0.001; ns = not significant (P > 0.05). (B) Representative histograms of fibroblast hormone receptor protein expression, confirming expression data for ER-α, ER-β, and PR in iSGS airway scar. ER-α (Abcam Alexa Fluor® 488); ER-β (Abcam PE); PR (Abcam Alexa Fluor® 647). Red = negative control; Blue = receptor expression. (C) Graph depicting the mean fluorescence intensity of ER-α, ER-β, and PR within fibroblasts isolated from airway scar of 5 iSGS patients via flow cytometry. Bar represents mean; error bars represent SEM; dots show individual cell lines.
