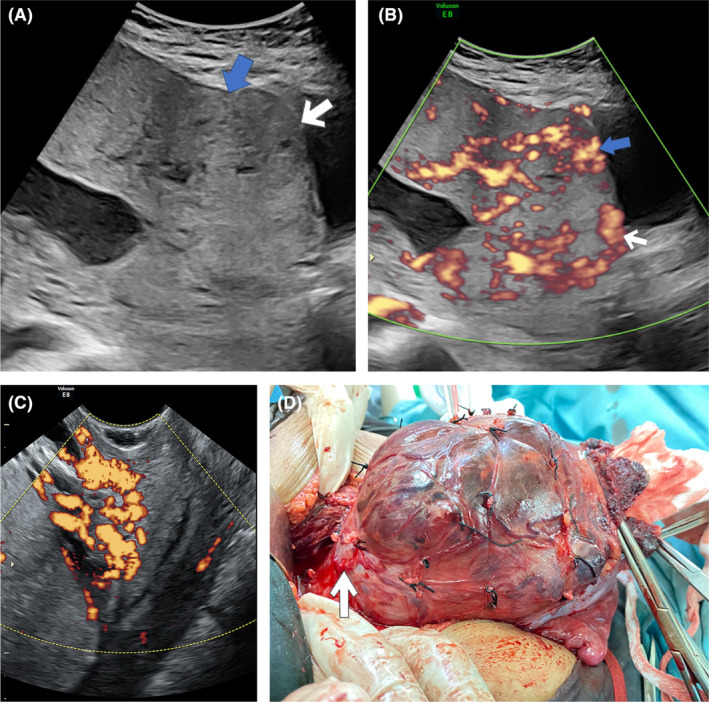
FIGURE 1.

(A) Transabdominal ultrasound: loss of clear zone (blue arrow) following the placental bulge (white arrow) that suggests placenta accreta spectrum in gray‐scale ultrasound. (B) Doppler ultrasound: bridging vessels (blue arrow) and subplacental hypervascularity in the lower uterine segment (white arrow) in addition to gray‐scale ultrasound. (C) Transvaginal ultrasound: tortuous hypervascularized anechoic spaces <50% of cervical tissue that measured from internal cervical ostium to external cervix. (D) The colpouterine vessels after bladder dissection (black arrow).
