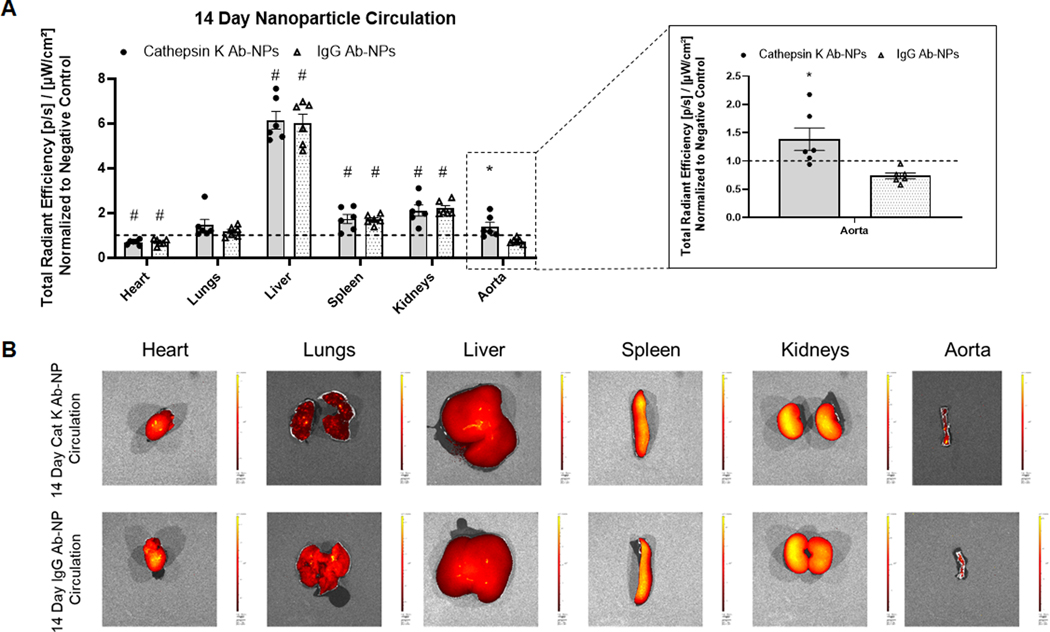
Fig. 5.
Comparison of the biodistribution of Vivotag800 encapsulated cat K Ab-NPs and IgG Ab-NPs after 14 days of NP circulation. Comparisons were made between antibody types and to the negative controls. Panel A: Total radiant efficiency of each test organ, indicative of NP presence, was normalized to negative control organs to control for background fluorescence. Results shown are based on analysis of n = 6 excised samples per group and represent mean ± SE. # denotes p < 0.05 compared to the Negative Control and * denotes p = 0.01 compared to IgG Ab-NP samples. Panel B: Representative images of each analyzed organ.

