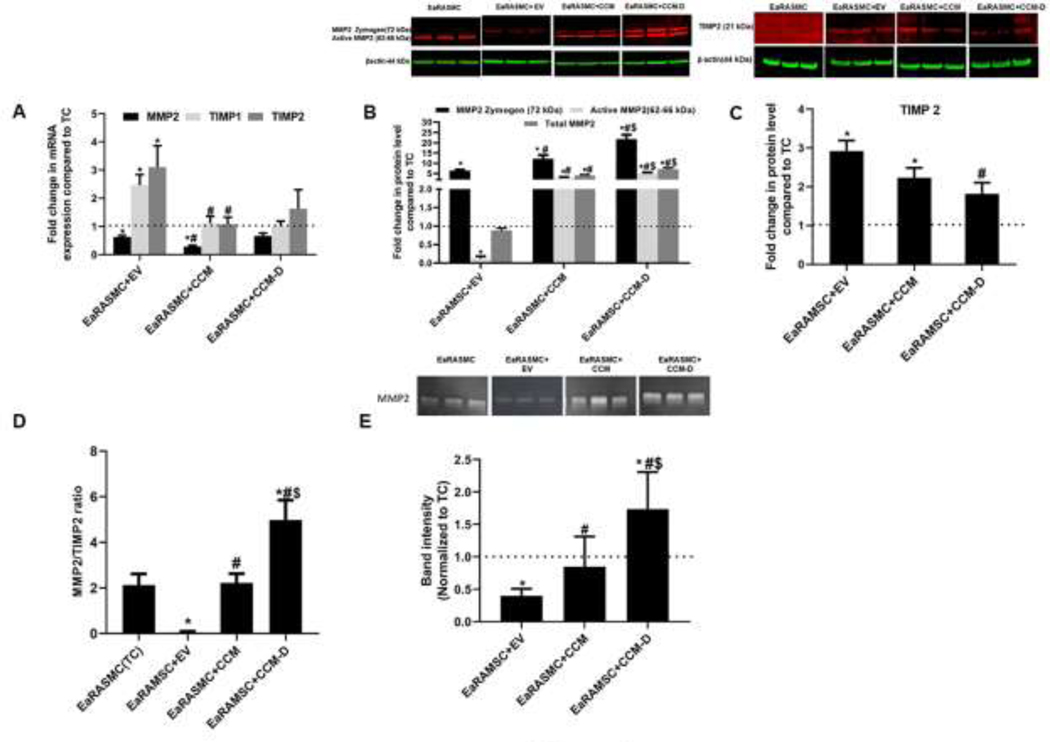
Figure 2. Effect of EV/CCM/CCM-D treatment on anti-proteolytic signaling proteins (MMP2 and TIMP2) expression in an EaRASMC culture model.
(A) Relative gene expression of MMP2/TIMP1/TIMP2 analyzed by RT-PCR. (B, C) WB analysis of β-actin normalized expression of MMP 2 and TIMP 2 proteins shown relative to values in treatment control cultures (TC). (D) Ratio of intensities of active MMP2 and TIMP2 bands on WB. (E) Gel zymogram analysis for MMP-2 enzymatic activity. In all plots, values shown indicate mean ± SE of measurements made in n = 6 replicate cultures per condition. * denotes p < 0.05 compared to TC cultures, # denotes p < 0.05 compared to EV treated samples, $ denotes p < 0.05 compared to CCM treated sample.

