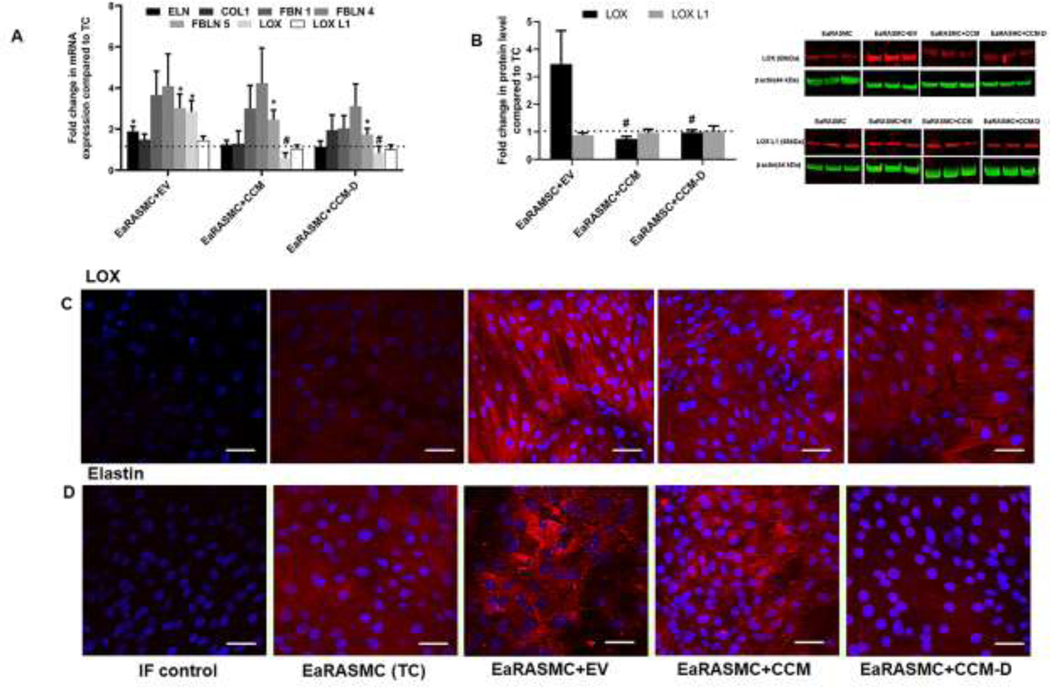
Figure 3. Effects of EV/CCM/CCM-D treatment on the expression of key elastic fiber assembly proteins in an EaRASMC culture model.
(A) Relative gene expression of key proteins involved in elastic fiber assembly and homeostasis analyzed by RT-PCR. (B) WB analysis for expression of elastin crosslinking proteins LOX and LOXL1. Protein band intensities were normalized to respective β-actin bands and values were then further normalized to the ratios obtained in treatment control (TC) cultures. In all plots, values shown indicate mean ± SE of measurements made in n = 6 replicated cultures per condition. *denotes p < 0.05 compared to TC cultures, # denotes p < 0.05 compared to EV treated samples, $ denotes p < 0.05 compared to CCM treated sample. Immunofluorescence (IF) micrographs showing expression of LOX (C), and elastin (D) deposition in EaRASMC cultures Cells nuclei were stained with DAPI (blue) and the proteins of interest visualized with a secondary antibody conjugated to an Alexa Fluor 568 dye (red). Scale bars in C and D: 50µm.

