. 2020 Jul 22;147(14):dev188011. doi: 10.1242/dev.188011

Fig. 6.

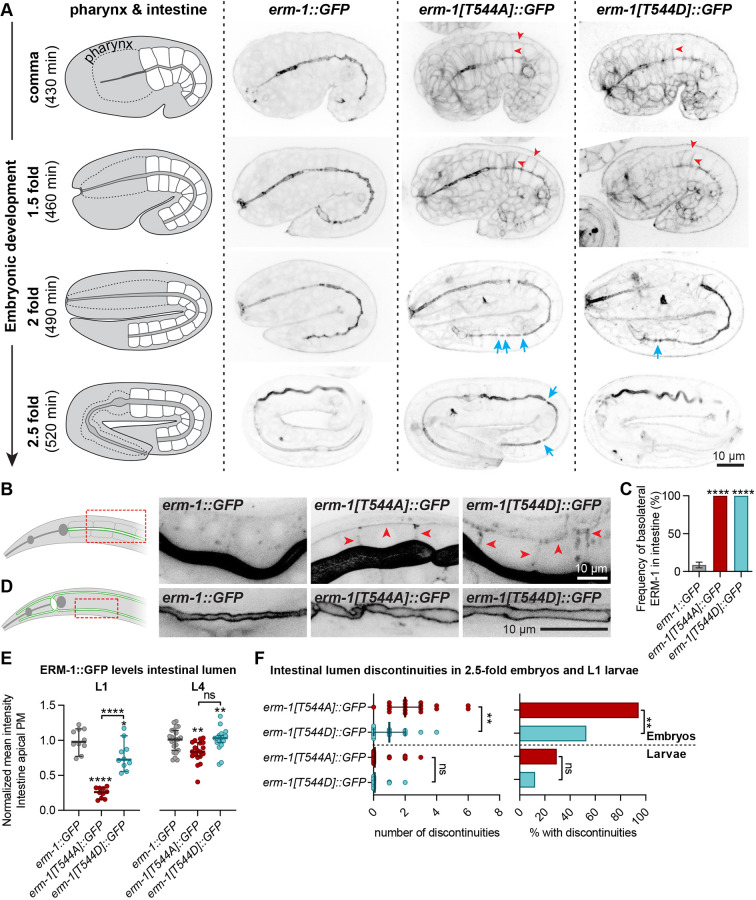
Fig. 6. T544 phosphorylation cycling supports apical recruitment of ERM-1 and intestinal lumen formation. (A) Distribution of ERM-1::GFP variants in different embryonic stages. Blue arrows indicate lumen discontinuities, and red arrowheads indicate examples of ectopic basolateral ERM-1 localization. (B) Basolateral localization (red arrowheads) of ERM-1::GFP variants in the intestine of L1 larvae. Images are overexposed for clarity. (C) Frequency of animals with ERM-1::GFP detectable at the basolateral membrane (n=58, 39 and 26). Statistical comparisons are with erm-1::GFP. (D) Apical localization of ERM-1::GFP variants in the excretory canal of L4 larvae. Red dashed rectangles in B and D indicate the area imaged. (E) Intensity of ERM-1::GFP variants at the apical intestinal membrane of L1 larvae. Each symbol represents an individual animal (n=10 for L1, and n=22, 19 and 17 for L4). Error bars are the median±95% CI. Statistical comparisons are with erm-1::GFP unless indicated otherwise. (F) Number of intestinal lumen discontinuities (median±95% CI) and fraction of animals with discontinuities in late embryos and L1 larvae (n=34, 41, 18 and 16 from top to bottom). Tests of significance: Fisher's exact test for D and bar graph in F; Tukey's multiple comparisons test for E; and Dunn's multiple comparisons test for dot plot in F. ns, not significant. **P≤0.01, ****P≤0.0001.

T544 phosphorylation cycling supports apical recruitment of ERM-1 and intestinal lumen formation. (A) Distribution of ERM-1::GFP variants in different embryonic stages. Blue arrows indicate lumen discontinuities, and red arrowheads indicate examples of ectopic basolateral ERM-1 localization. (B) Basolateral localization (red arrowheads) of ERM-1::GFP variants in the intestine of L1 larvae. Images are overexposed for clarity. (C) Frequency of animals with ERM-1::GFP detectable at the basolateral membrane (n=58, 39 and 26). Statistical comparisons are with erm-1::GFP. (D) Apical localization of ERM-1::GFP variants in the excretory canal of L4 larvae. Red dashed rectangles in B and D indicate the area imaged. (E) Intensity of ERM-1::GFP variants at the apical intestinal membrane of L1 larvae. Each symbol represents an individual animal (n=10 for L1, and n=22, 19 and 17 for L4). Error bars are the median±95% CI. Statistical comparisons are with erm-1::GFP unless indicated otherwise. (F) Number of intestinal lumen discontinuities (median±95% CI) and fraction of animals with discontinuities in late embryos and L1 larvae (n=34, 41, 18 and 16 from top to bottom). Tests of significance: Fisher's exact test for D and bar graph in F; Tukey's multiple comparisons test for E; and Dunn's multiple comparisons test for dot plot in F. ns, not significant. **P≤0.01, ****P≤0.0001.