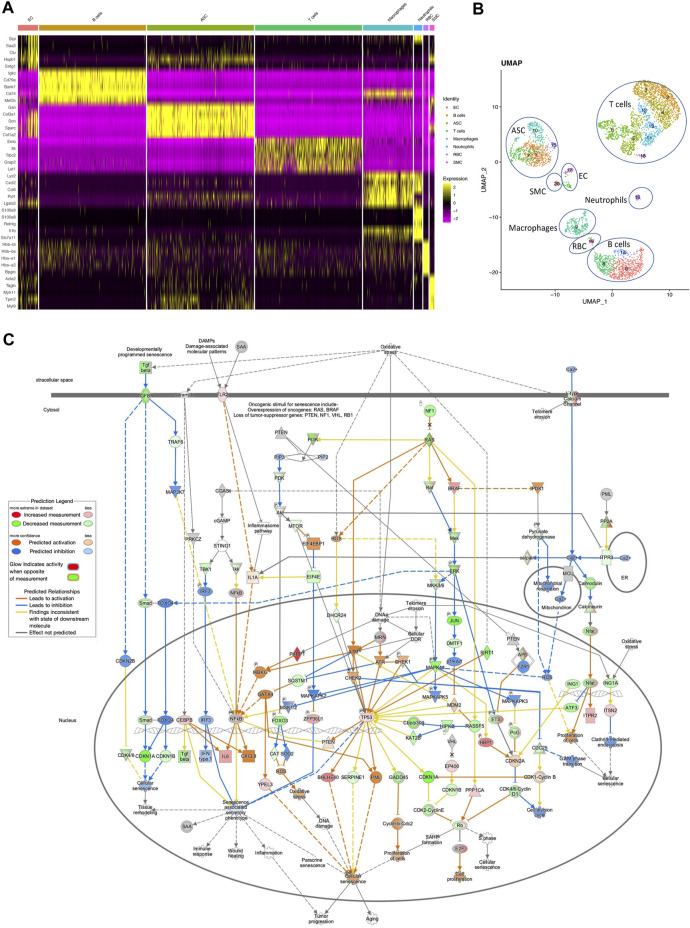
FIGURE 2.
Single cell transcriptomics of adipose cells from EC Tert KO mice. TERT-EC-KO and WT 7-month-old male mice were fed HCD for 5 months prior to cells isolation from SAT and VAT and RNAseq. (A), Integrated heatmap of combined RNAseq data with genes (left) identifying cell clusters designated on top. ACS, adipose stromal cells; RBC, red blood cells; SMC, smooth muscle cells. (B), Regression UMAP clusters of combined KO and WT cells from SAT and VAT generated based on the first 10 principal components displayed with the log (raw read count +1) of gene/cell. (C), Pathways upregulated in SAT EC of EC-TERT KO mice fed chow identified in scRNAseq data by IPA analysis focusing on senescence-related pathways.

