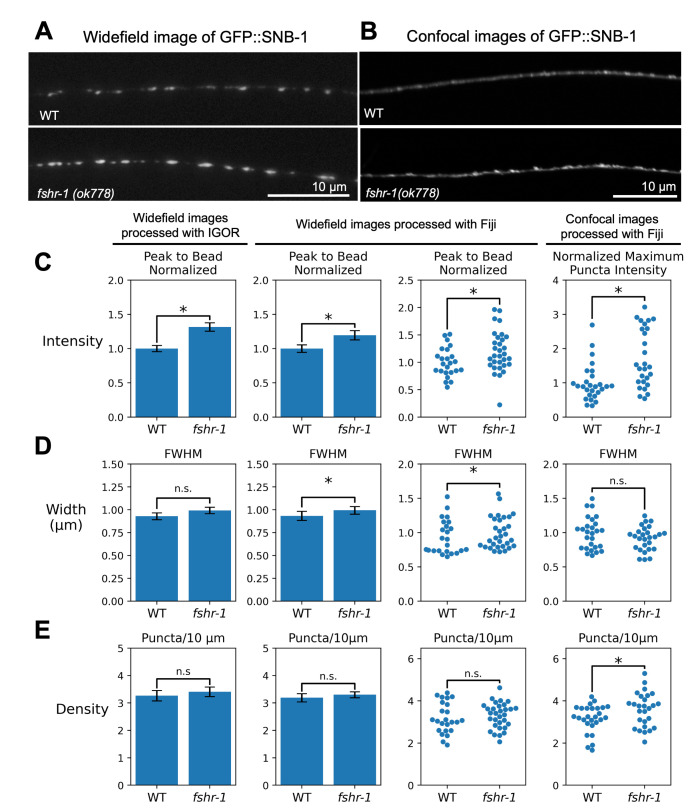
Figure 1. Comparison of analyses of widefield and confocal images of GFP::SNB-1 using Igor and Fiji.
A, B. Representative images of WT and fshr-1 mutant animals expressing GFP::SNB-1 imaged using widefield and confocal microscopy, respectively. C . Quantification of puncta intensity (peak-to-bead) per animal. Left, original quantification using IgorPro software; Center; analysis of the same data set using the Fiji macros (shown as bar graphs, with error bars representing SEM, left, and swarm plots, right); Right, quantification of images acquired using confocal microscopy by the Fiji macros displayed as swarm plots to show normalized intensity values for individual animals. Statistics for all plots are described in the text. D, E . Quantification of puncta width measured as Full-width Half-maximal (FWHM) fluorescence (D) and puncta per 10 𝜇m (E).

