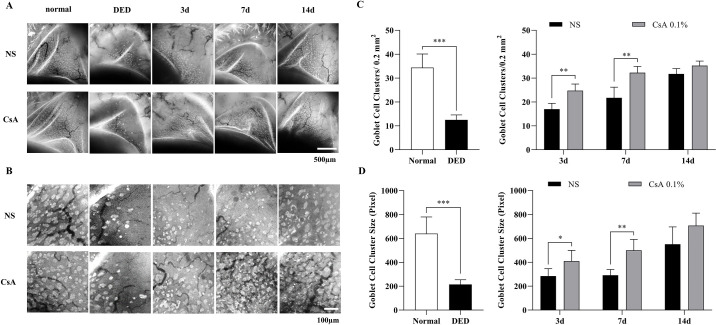
Figure 2.
In vivo conjunctival goblet cell (GC) images and quantitative analysis results of DED mice after DED induction and during treatment. (A) Representative conjunctival GC images in all experimental groups, including normal mice, DED mice treated with NS, and DED mice treated with CsA after DED induction and on days 3, 7, and 14 of the treatment period. (B) Magnified GC images from the selected region of (A) for the calculation of GC density (GCD) and area (GCA). (C) Conjunctival GCDs of the experimental groups from the magnified images in (B). (D) Conjunctival GCAs of the experimental groups from the magnified images in (B). Data are presented as the mean ± standard deviation, and data between normal and DED groups were analyzed by the t-test and Mann–Whitney U test. Data on days 3, 7, and 14 of treatment between the NS and CsA groups were analyzed by the multiple t test. Statistical significance was assessed using the Holm–Sidak method, N = 7, *P < 0.05.

