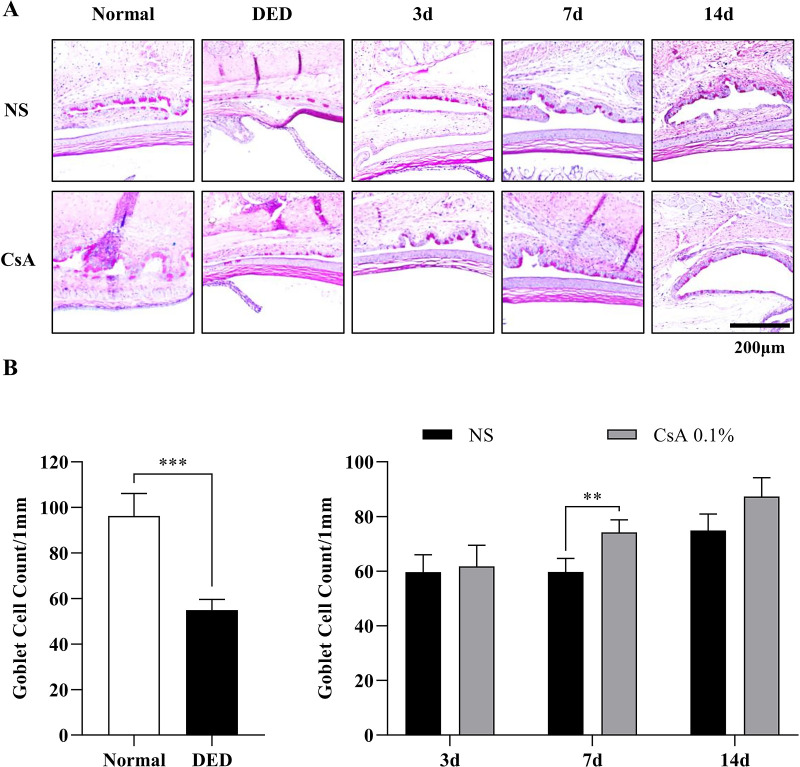
Figure 3.
Histological analysis of goblet cells (GCs) and their density in DED mice after induction and during treatment. (A) Periodic acid-Schiff (PAS)-stained histological images in all the experimental groups of normal mice, NS-treated DED mice, and CsA-treated DED mice. (B) GC densities between the normal and DED groups and longitudinal changes in GC densities in the NS-treated and CsA-treated DED groups. GC density was obtained by counting PAS-positive GCs divided by the epithelium length. Data are presented as the mean ± standard deviation, and GC densities of the normal and DED groups were analyzed by the t test and Mann–Whitney U test. The GC densities of the NS-treated and CsA-treated DED groups on days 3, 7, and 14 of the treatment period were analyzed by performing the multiple t test. Statistical significance was determined using the Holm–Sidak method, N = 7, *P < 0.05.

