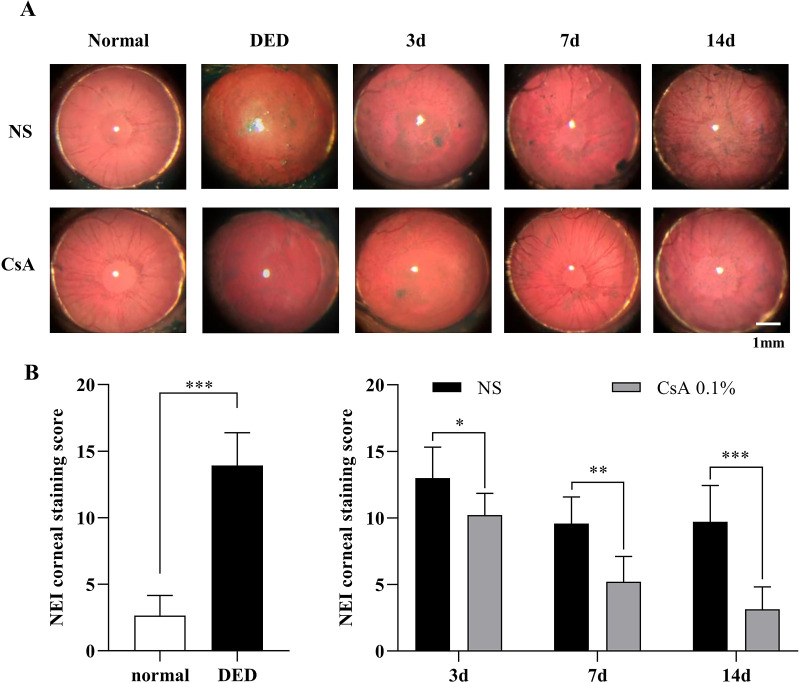
Figure 5.
Corneal staining score analysis of DED mice after DED induction and during treatment. (A) Corneal staining images with lissamine green in all the experimental groups, including normal mice, NS-treated DED mice, and CsA-treated DED mice, during treatment. (B) Corneal staining scores of the normal and DED mice and longitudinal changes in corneal staining scores in the NS-treated and CsA-treated DED groups during treatment. Data are presented as the mean ± standard deviation, and corneal staining scores of the normal and DED mice were compared with the t test and Mann–Whitney U test. Staining scores of the NS-treated and CsA-treated DED groups on days 3, 7, and 14 of treatment were compared with the multiple t test. Statistical significance was assessed using the Holm–Sidak method, N = 7, *P < 0.05.

