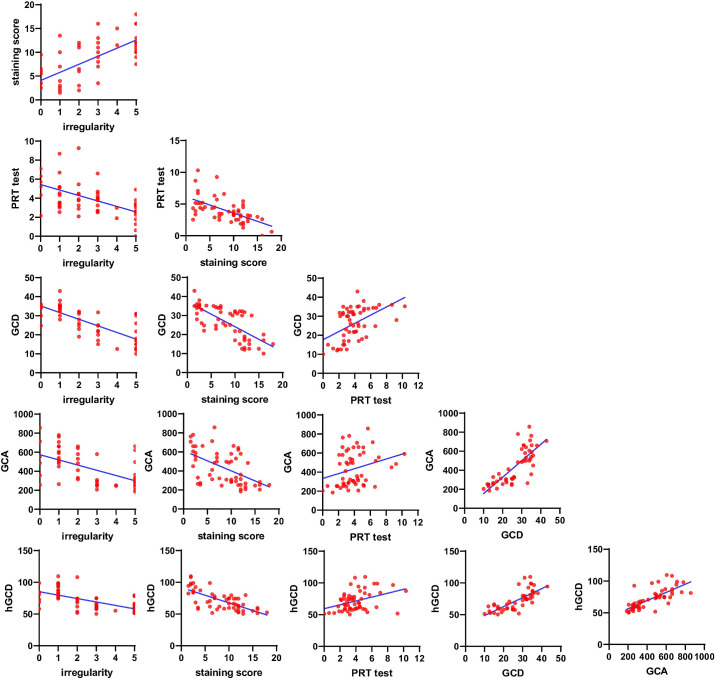
Figure 7.
Correlation analysis was conducted using scatterplots for each test, and linear regression analysis was performed to assess the relations. The data showing the correlation between the two groups are presented in Table 2. GCD, goblet cell density; GCA, goblet cell area; PRT, phenol-red thread test.

