
FIGURE 4.
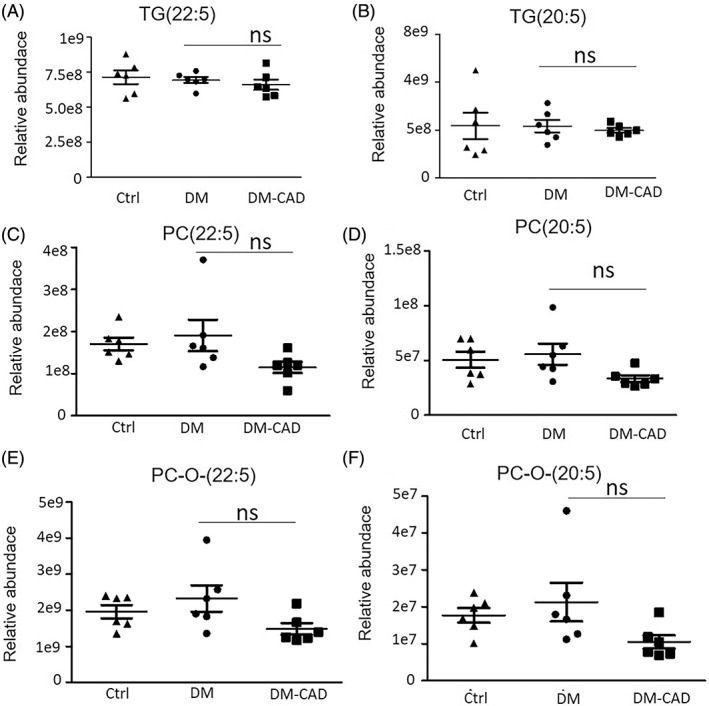
Relative abundance of n‐3 EPA (20:5) and DPA (22:5) enriched glycerides by lipidomic analysis. Relative abundance of (A)TG(22:5); (B) TG(20:5); (C) PC(22:5) ; (D) PC(20:5); (E) PC‐O‐(22:5); (F) PC‐O‐(20:5). The bar graphs indicate the mean ± SEM of 6 independent replicates. #p < .05. DM, diabetic patients without cardiovascular diseases; DM‐CAD, diabetic patients with cardiovascular diseases; DPA, docosapentaenoic acid; EPA, eicosapentaenoic acid; PC, phosphatidylcholine; TG, triacylglycerol.