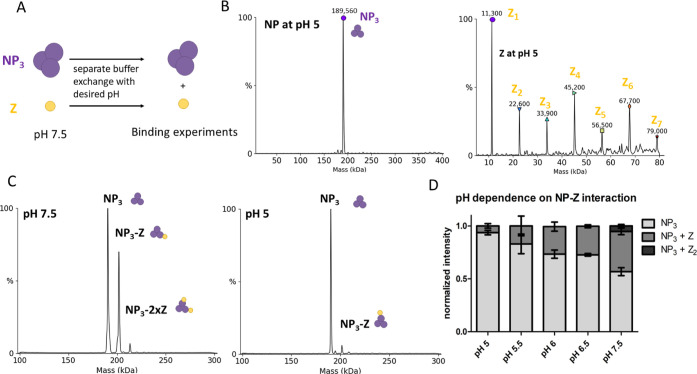
Figure 10.
NP–Z interaction is less efficient at lower pH. (A) Scheme of the pH-dependent interaction assay. Proteins were separately exchanged to a 150 mM ammonium acetate surrogate with adjusted pH. NP (6 μM) and Z at the same pH were incubated in a 1:3 (NP/Z) molar ratio and measured by nMS. (B) Deconvoluted spectra of NP and Z after the buffer was changed to pH 5.0. NP oligomerization status was unaltered, whereas Z starts to oligomerize at pH 5.0 and 5.5. (C) Spectra of NP and Z in a 1:3 molar ratio at different pH. (D) Normalized intensity for every mass species from the deconvoluted spectra was plotted according to the different pH conditions. The sum of all mass species for one measurement was set to 1. Error bars represent the standard deviation of at least 3 independent measurements.

