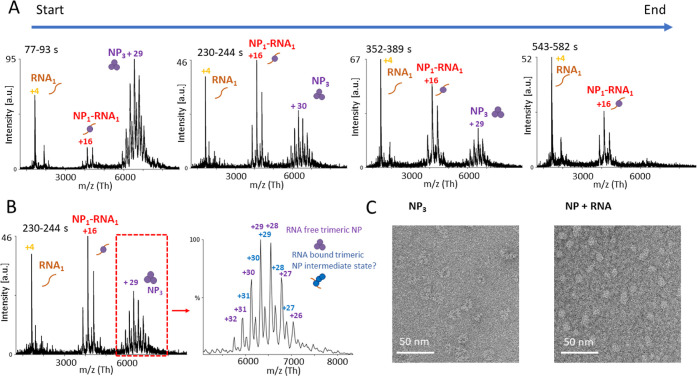
Figure 6.
RNA triggers the dissociation of NP3 into monomers. NP3 and a 9 nt RNA were mixed together in a 150 mM ammonium acetate solution at pH 7.5 on ice in a 1:1 (NP1/RNA) molar ratio. The mixture was placed into an ESI capillary, and the measurement was started approximately 30 s after mixing RNA and NP together. Spectra were recorded over 550 s. (A) Each diagram represents combined spectra recorded at 77–93, 230–244, 355–389, and 543–582 s with the intensity in arbitrary units (a.u.). Main charge states are labeled. Shown is one representative measurement of at least three independent measurements. (B) Recorded spectrum at time point 230–244 s. Zoom into the m/z range between 5000 and 8000 shows an RNA-bound NP3 (193.00 ± 0.08 kDa) species. (C) NP at 160 nM was mixed with a single-stranded 25 nt RNA at a 1:2 molar ratio (NP/RNA) (Table S3) and incubated at room temperature for approximately 15 min. NP was applied to glow-discharged carbon-coated copper grids and stained with uranyl acetate immediately before imaging. Images were collected with a transmission electron microscope.

