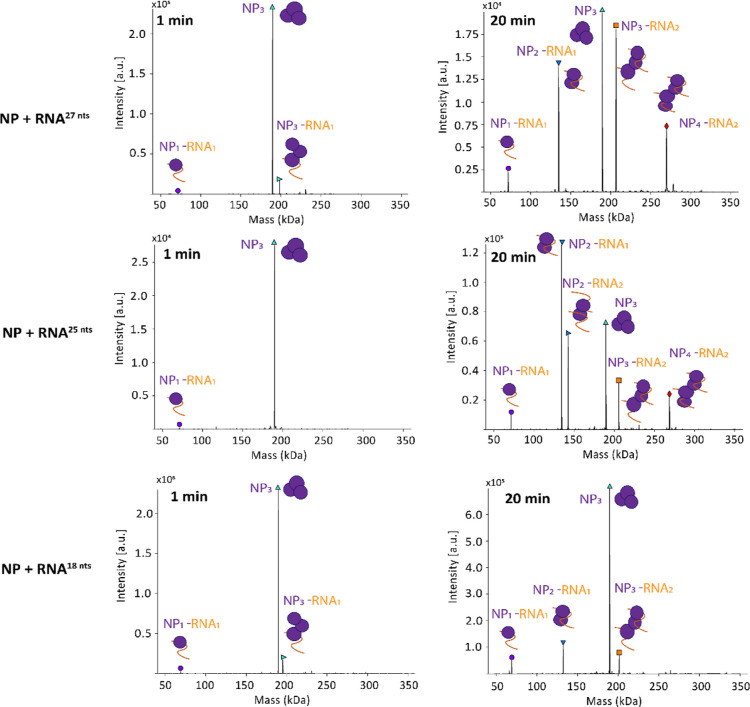
Figure 8.
Representative measurement of NP together with a 27, 25, and 18 nt RNA in a 1:1 (NP/RNA) molar ratio. Spectra were analyzed as in Figure 7. Time points at 1 and 20 min are depicted. For the 27 nt RNA, masses corresponding to NP3 (189.56 ± 0.02 kDa), NP3-RNA1 (198.19 ± 0.05 kDa), and NP1-RNA1 (71.79 ± 0.03 kDa) were detectable at the 1 min time point. At the 20 min time point, additional masses corresponding to NP2-RNA1 (134.95 ± 0.04 kDa), NP3-RNA2 (206.69 ± 0.04 kDa), and NP4-RNA2 (269.92 ± 0.05 kDa) were visible. For the 25 nt RNA, masses corresponding to NP3 (189.56 ± 0.02 kDa) and NP1-RNA1 (71.16 ± 0.01 kDa) were detectable at the 1 min time point. At the 20 min time point, additional masses corresponding to NP2-RNA1 (134.29 ± 0.01 kDa), NP3-RNA2 (205.44 ± 0.02 kDa), and NP4-RNA2 (268.62 ± 0.02 kDa) were visible. For the 18 nt RNA, masses corresponding to NP3 (189.56 ± 0.02 kDa), NP3-RNA1 (195.27 ± 0.01 kDa), and NP1-RNA1 (68.97 ± 0.03 kDa) were detectable at the 1 min time point. At the 20 min time point, additional masses corresponding to NP2-RNA1 (132.12 ± 0.03 kDa) and NP3-RNA2 (201.09 ± 0.03 kDa) were visible.

