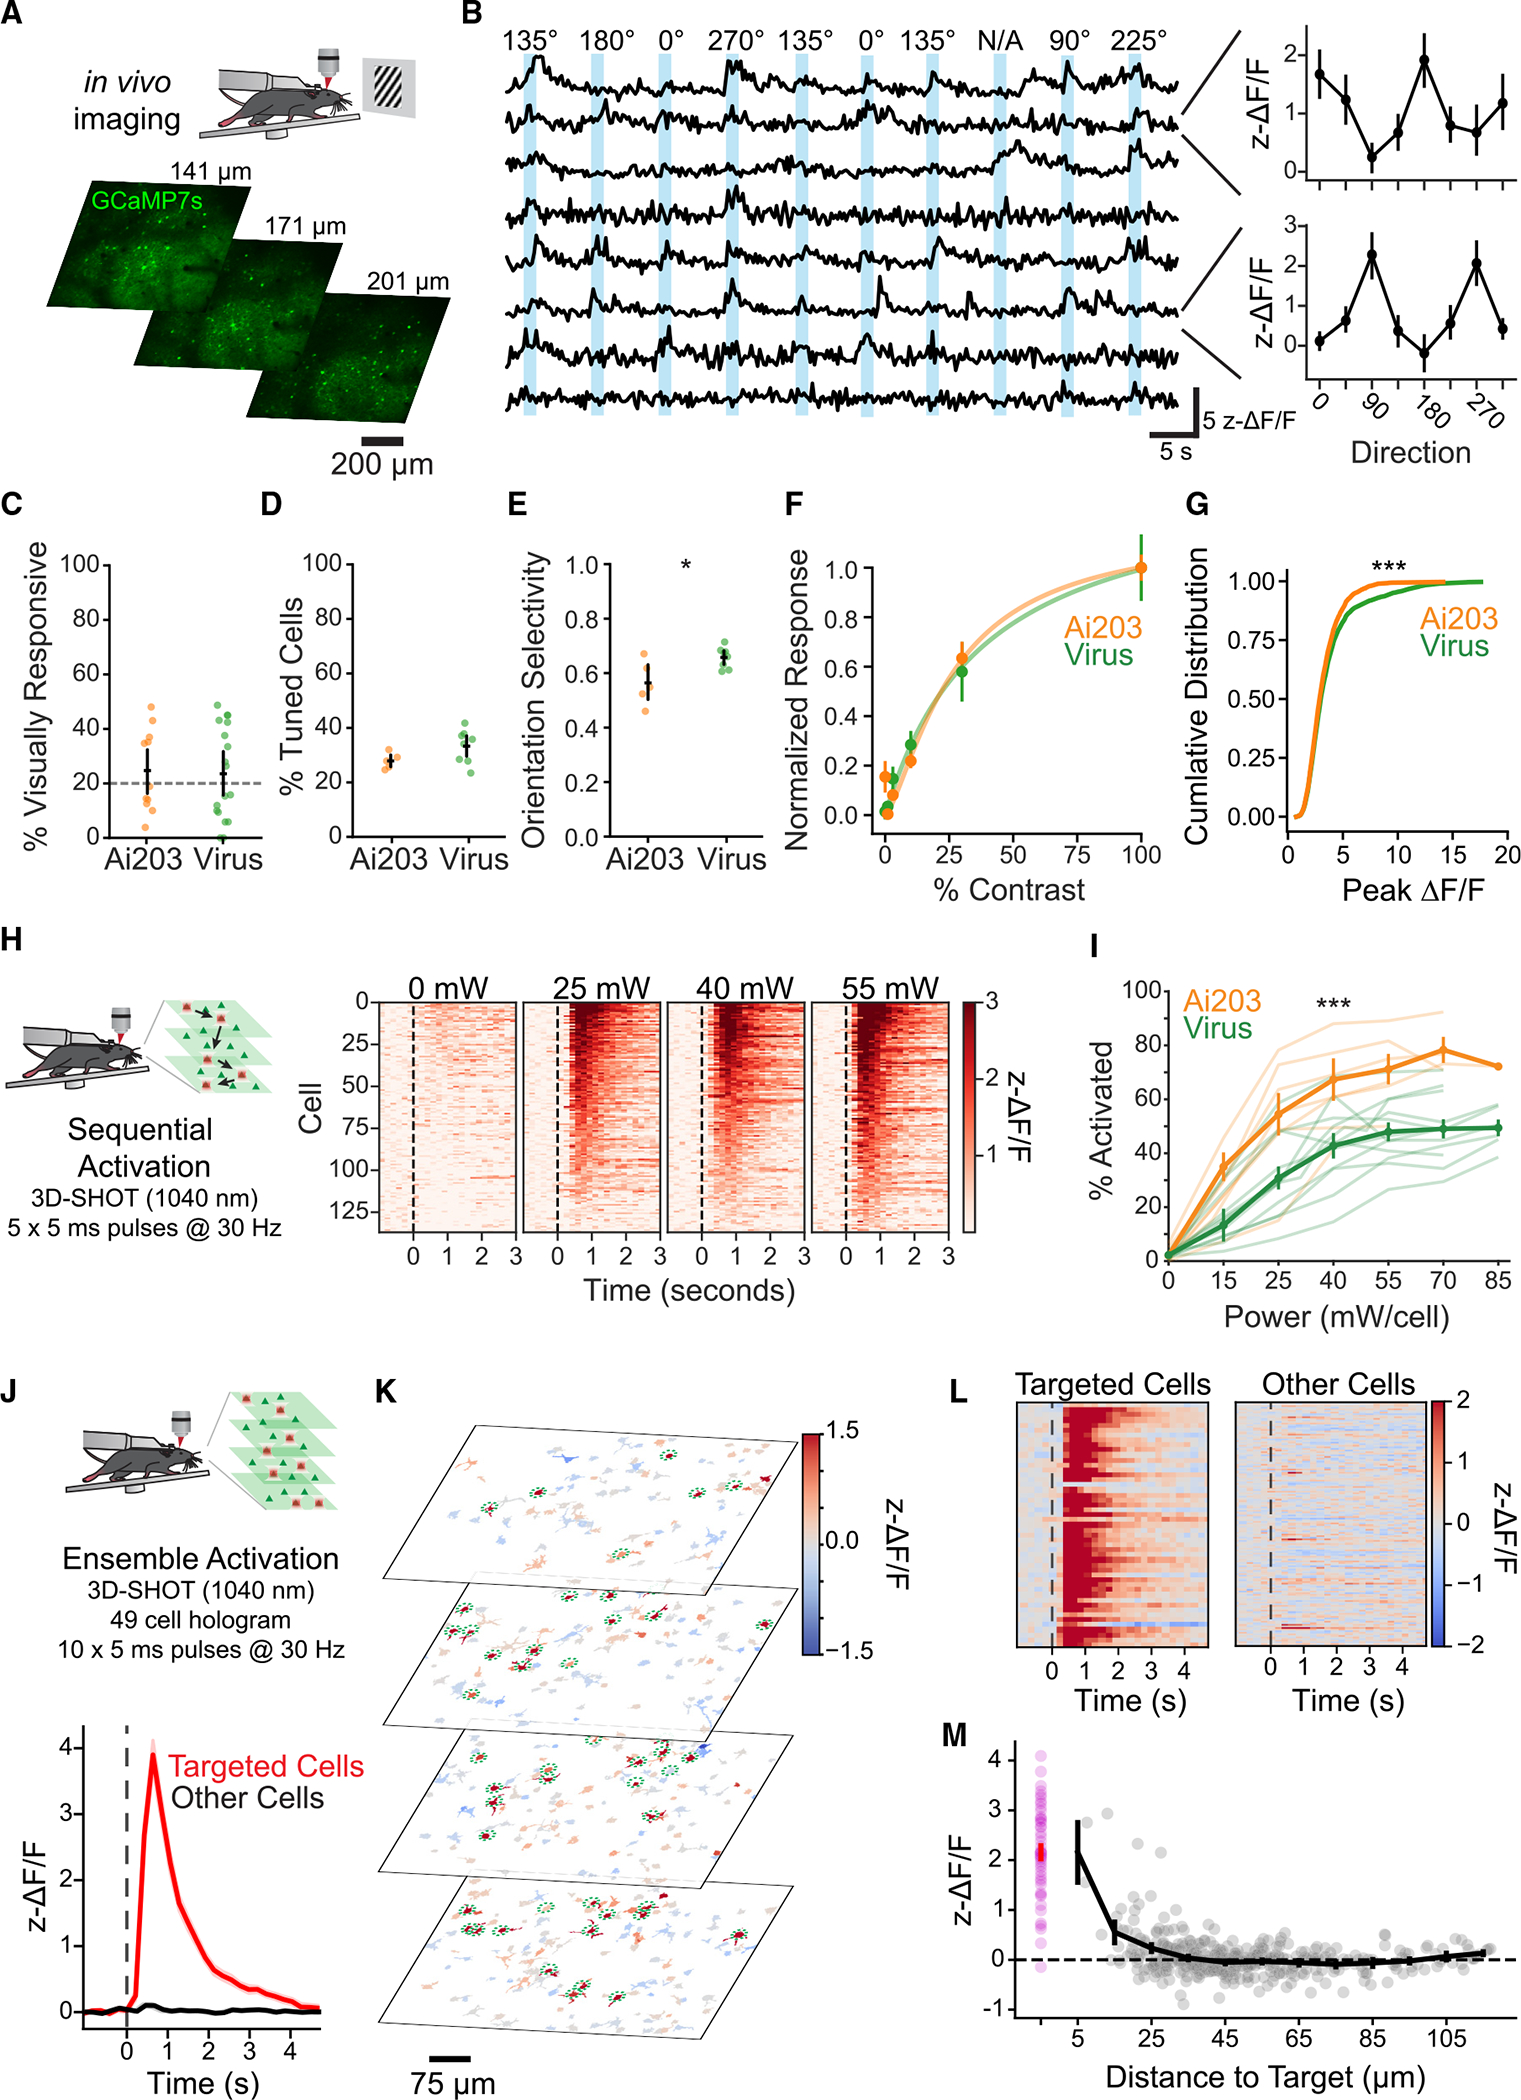
Figure 2. 2p imaging of in vivo visually and holographically evoked responses in VGlut1-Cre;Ai203 mice.

(A) Top: schematic of in vivo imaging paradigm. Bottom: example fields of view for three-plane (6.4-Hz volumetric imaging rate, FOV size ~820 μm) imaging at power 50 mW.
(B) Left: example traces of fluorescence responses to drifting gratings in V1 cells expressing st-ChroME-GCaMP7s, showing z-ΔF/F (Z-scored ΔF/F, see STAR Methods). Right: direction tuning curves for two example cells.
(C–G) Comparisons of visually evoked activity between VGlut1-Cre;Ai203 mice (Ai203, orange) and Camk2a-tTA;tetO-GCaMP6s mice expressing viral st-ChroME (virus, green).
(C) Comparison of percentage visually responsive cells between Ai203 (n = 11 FOVs) and virus (n = 18 FOVs). p = 0.85, t test. FOVs with <20% visually responsive cells were excluded from further analysis (dashed line).
(D) Comparison of percentage significantly tuned cells between Ai203 (n = 5 FOVs) and virus (n = 8 FOVs). p = 0.095, t test.
(E) Comparison of orientation-selectivity index of significantly orientation-tuned cells, mean per FOV for Ai203 (n = 5 FOVs) and virus (n = 8 FOVs). p = 0.016, t test.
(F) Contrast response functions (points) and corresponding Naka-Rushton fits (lines) to contrast modulated noise in Ai203 (n = 6 FOVs) and virus (n = 4 FOVs). p = 0.68, two-way ANOVA.
(G) Cumulative distribution of peak ΔF/F response to drifting gratings for Ai203 (n = 2,686 cells) and virus (n = 2,875 cells). p = 0.000025, rank-sum test.
(H) Left: schematic sequential holographic stimulation experiment. Targeted cells were sequentially activated, with imaging as in (A). Right: example experiment. Heatmaps of z-ΔF/F responses at different powers for 137 significantly activated cells out of 159 targeted cells (15, 110, 108, and 137 cells were activated at 0, 25, 40, and 55 mW, respectively. p < −0.05, one-tailed rank-sum test).
(I) Quantification of the fraction of neurons per FOV activated at various powers for experiments in Ai203 (n = 7 FOVs) and virus (n = 12 FOVs). Thin lines, individual sessions. p = 0.00012, repeated measures ANOVA.
(J) Top: schematic of ensemble stimulation. Neurons across four planes (4.8-Hz volumetric imaging rate, 75-mW imaging power) were targeted simultaneously in a single hologram with 45 mW/cell of power. Ten pulses of duration 5 ms were delivered at 30 Hz. Bottom: average responses from targeted (red) and non-targeted (black) cells.
(K) Images showing individual cell responses during stimulation; cell masks are colored by z-ΔF/F.
(L) Right: heatmap showing z-ΔF/F for targeted (n = 49) and non-targeted cells (n = 445); 46 out of 49 target cells were activated by stimulation (p < 0.05, one-tailed rank-sum test).
(M) Response of target cells (magenta) and non-targeted cells (gray) by distance to nearest coplanar target cell. Black, mean based on binned distance; gray, individual cells plotted by real distance. Data are presented as mean ± SEM.
