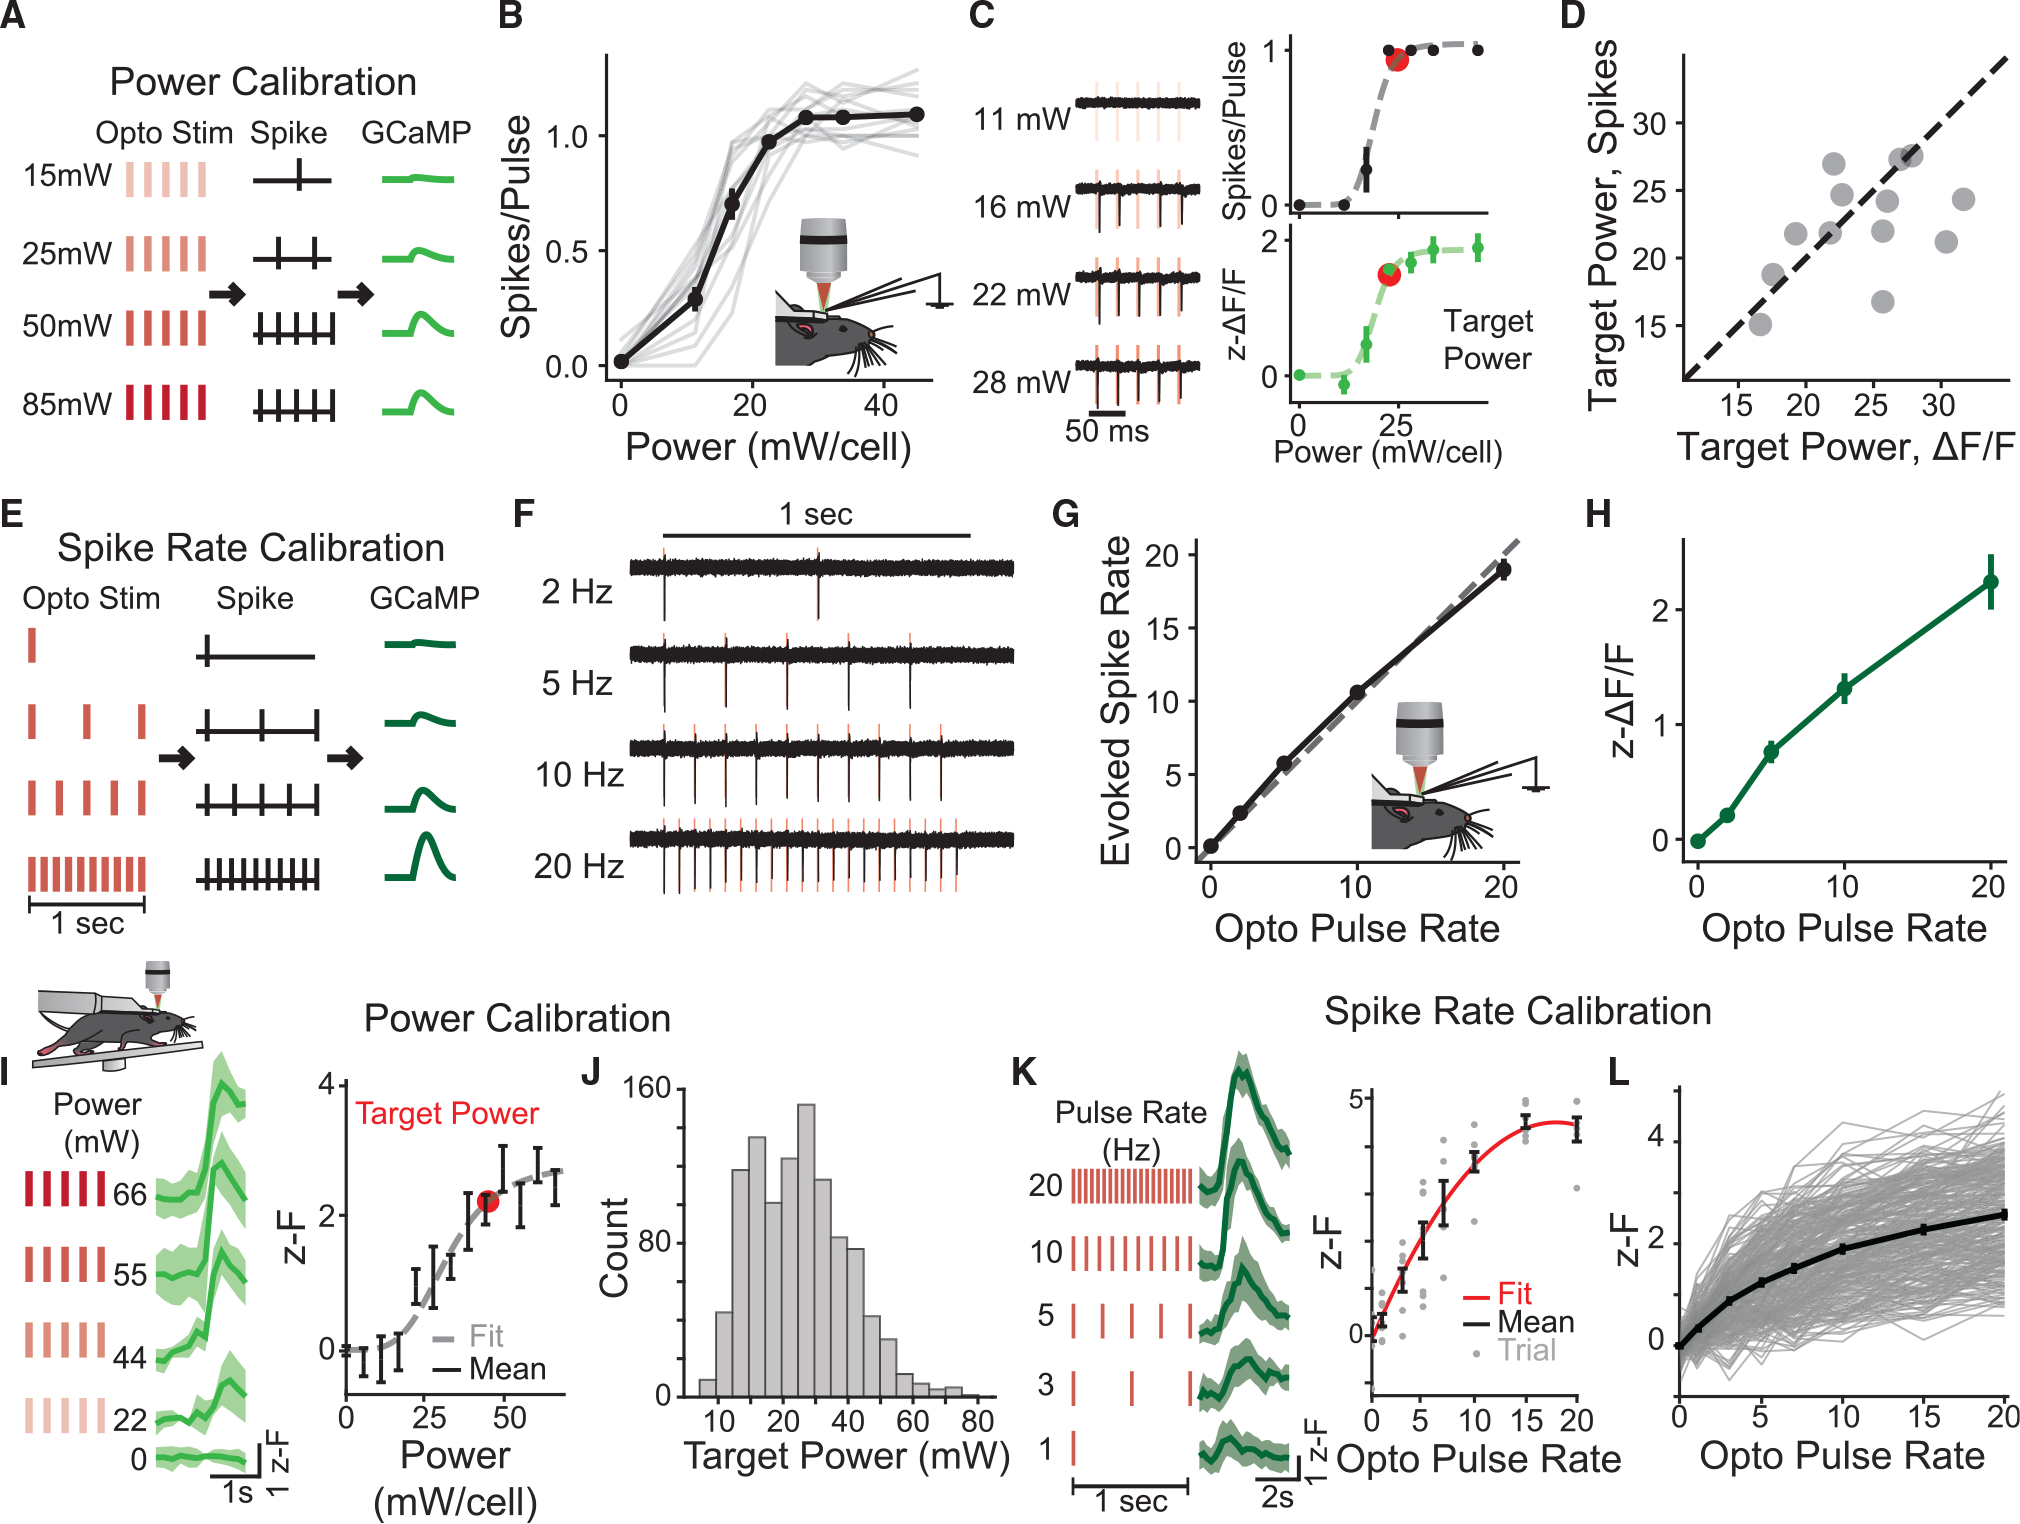
Figure 3. Calibration of stimulation, spiking, and GCaMP fluorescence.

(A) Schematic of the power calibration procedure. Cells are stimulated with five 5-ms pulses at varying power to determine the power necessary to evoke a single spike per pulse.
(B) Number of spikes per pulse evoked in response to a train of five pulses at different powers recorded in vivo in lightly anesthetized mice. Gray lines, individual cells. n = 13 cells.
(C) Left: single-trial light-induced spike responses at different powers in an example cell. Right: spiking (top) and z-ΔF/F response (bottom) from the same cell. Dashed line, fit curve. Red, target power.
(D) Target power (i.e., the power needed to drive one spike per pulse) identified from the electrophysiological data (y axis) fit versus estimated target power from the fluorescence response fit (x axis). Gray dots, individual cells; dashed line indicates perfect correspondence. n = 13 cells.
(E) Schematic of the spike rate calibration procedure. Cells are stimulated at a power slightly above the target power at different spike rates for a fixed 1 s of stimulation.
(F) Example spiking responses to different photostimulation pulse rates for the same cell in (C).
(G) Evoked spike rate vs. optogenetic pulse rate during spike rate calibration. Dashed line indicates perfect correspondence. See also Figure S8.
(H) z-ΔF/F vs. optogenetic pulse rate for the cells in (G).
(I–L) In vivo awake, all-optical calibrations performed with three-plane imaging at imaging power 50 mW.
(I and J) All-optical power calibration.
(I) Calcium responses of an example cell stimulated with five optogenetic pulses at varying power. Left: calcium responses at different illumination powers, mean ± 95% confidence interval. Right: power-to-fluorescence response curve for example cell.
(J) Histogram of target powers of all fitted cells, n = 1,057 cells, eight FOVs, five mice.
(K and L) All-optical spike rate calibration.
(K) Calcium responses in an example cell photostimulated with trains at different pulse rates for 1 s (total pulses = pulse rate). Left: traces at different spike rates, mean ± 95% confidence interval. Right: response of an example cell. Black, mean; gray dots, individual trials.
(L) Fluorescence response vs. optogenetic pulse rate for all 281 fitted cells from six FOVs in four mice. Light gray, individual cells; black, mean. Data are presented as mean ± SEM unless otherwise noted.
