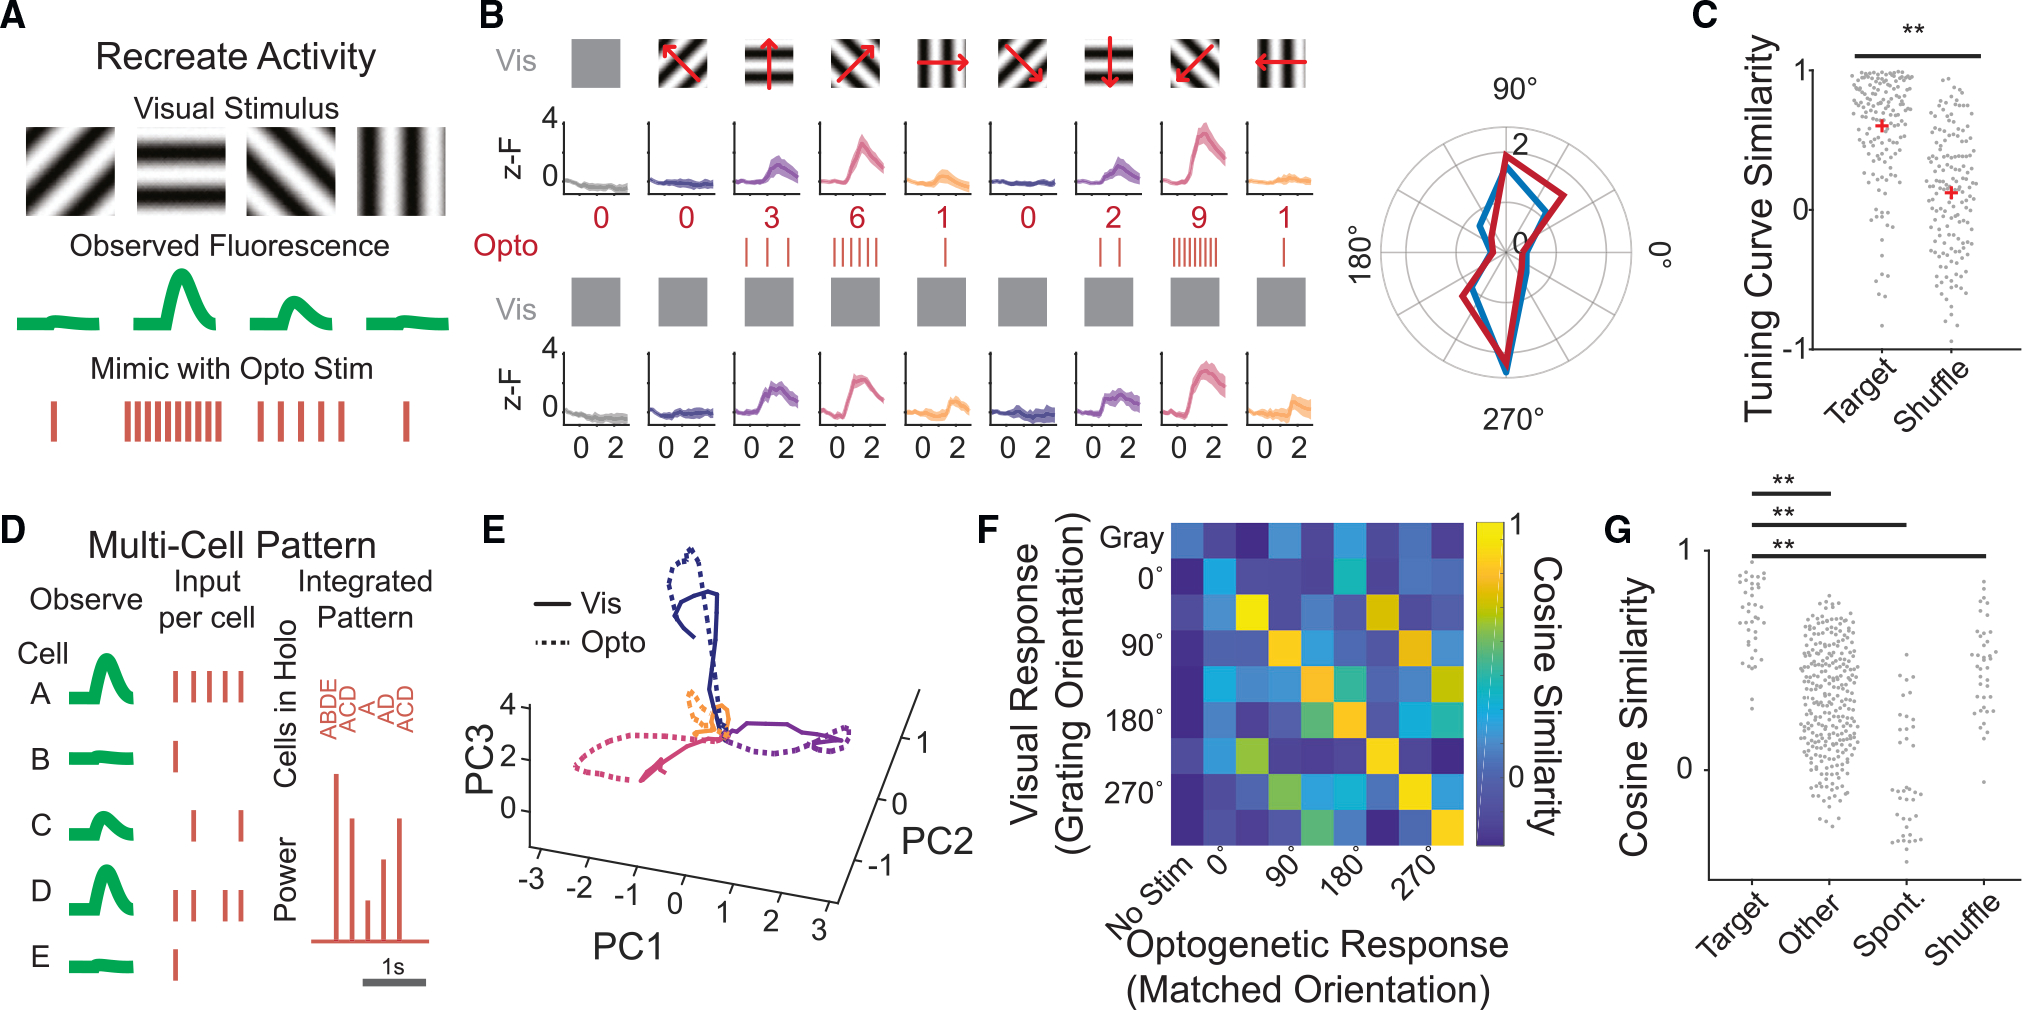
Figure 4. Reproducing naturalistic responses with 2p stimulation.

(A) Schematic of the strategy for recreating observed activity using calibrated 2p optogenetics.
(B) Top: visually evoked calcium responses to oriented gratings in an example neuron. Traces are mean ± 95% confidence interval. Middle: the calculated number of pulses needed to recreate the visual response with optogenetic stimulation alone. Bottom: calcium responses of the same cell during 2p optogenetic stimulation intended to recreate its visual response to each grating. Right: polar plot of the cell’s tuning curve, visually evoked (blue) or by optogenetics alone (red). (C) Tuning curve similarity of all visually evoked tuning curves vs. the optogenetically evoked tuning curves compared with shuffled controls. p < 3e–17 rank-sum test. n = 155 cells, five FOVs, three mice.
(D) Schematic of the multi-cell pattern writing approach.
(E) Population activity from stimulated cells in an example FOV during visual stimulus (solid lines) or optogenetic-only stimulation (dotted lines), for four drifting gratings, colors as in (B). Dimensionality is reduced via principal-component analysis.
(F) The cosine similarity between the visually evoked population activity and that evoked by optogenetic stimulation, for all tested holographic patterns from anexample FOV.
(G) Cosine similarity of an optogenetically evoked population vector to its target visually evoked pattern (“target”), a different visually evoked pattern (“other”),spontaneous activity (“spont”), or a shuffled dataset (“shuffle”). p values determined by rank-sum test. Target vs. other, p < 5.5e–16; target vs. spont, p < 5.5e–14; target vs. shuffle, p < 1.9e–6. n = 40 optogenetically evoked patterns, five FOVs, three mice. Ensembles contained between 19 and 43 cells.
