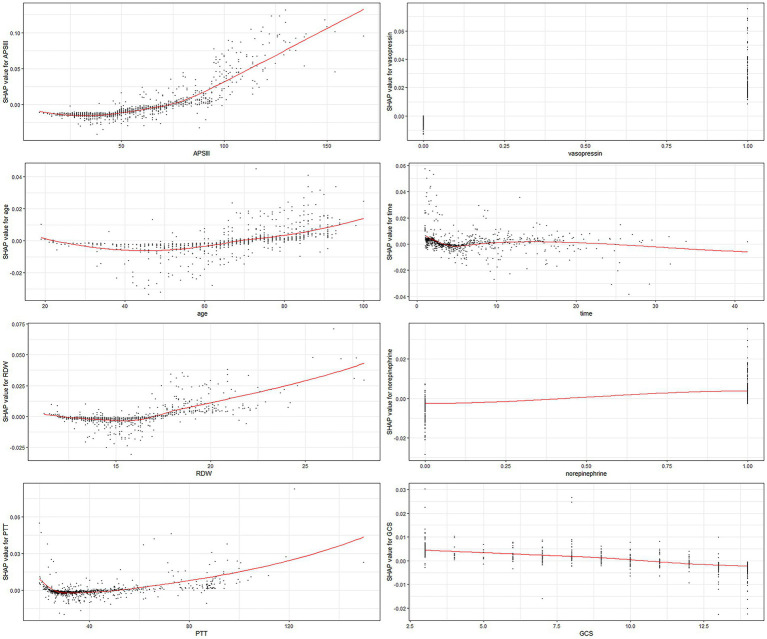
Figure 3.
SHAP dependency plot of the XGboost model. The SHAP dependence plot shows how a single feature affects the output of the XGBoost prediction model. SHAP values for specific features exceed zero, representing an increased risk of death. RDW, red blood cell distribution width; PTT, partial thromboplastin time.

