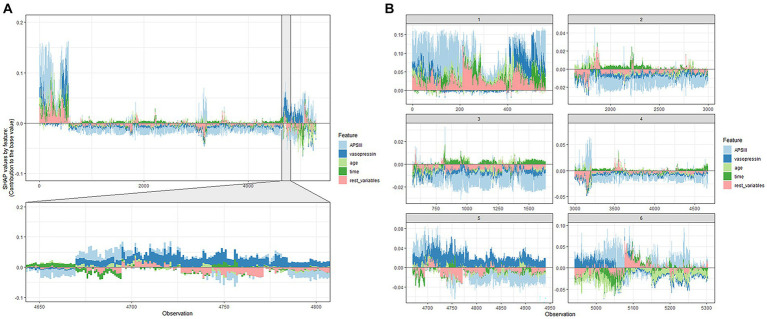
Figure 5.
SHAP force plot of the XGboost model. (A) Influence plot of macroscopic features for all samples. (B) Influence plot of macroscopic features for a random portion of the samples. A positive Shap value represents a positive gain area and a negative Shap value represents a negative gain area.

