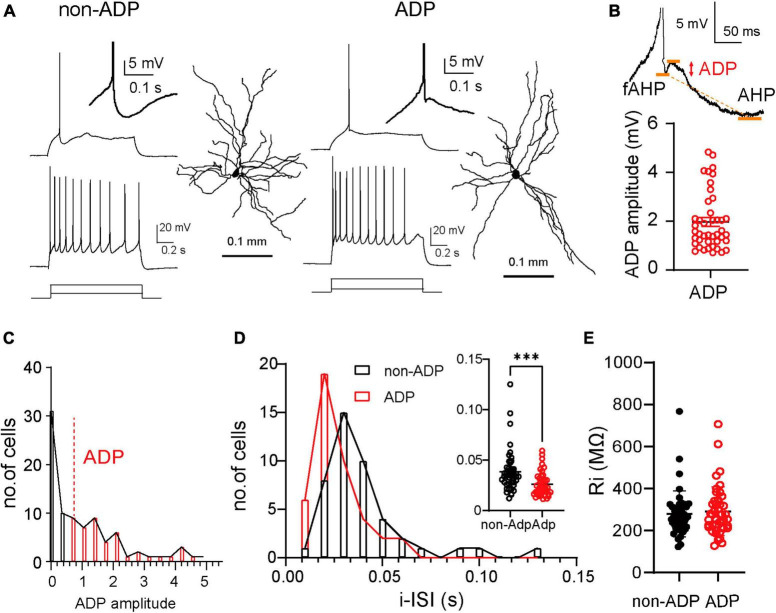
FIGURE 1.
Two distinct firing subtypes in the lateral amygdala. (A) Example of a single action potential (AP) and repetitive firing patterns to depolarized current injection (non-ADP cells: 80 pA and 200 pA; ADP cells: 50 pA and 200 pA) and dendritic morphologies of the excitatory non-ADP and ADP cells. Inset showed non-ADP and ADP. (B) ADP measured the peak between the fast AHP (fAHP) and AHP. The plots showed the ADP amplitude (n = 43 cells from N = 26 mice). (C) The distribution of the ADP in all cells (non-ADP cells: n = 44 cells from N = 24 mice; ADP cells: n = 43 cells from N = 26 mice). (D) The histogram of the initial inter-spike interval (i-ISI) of the non-ADP (black) and ADP cells (red). Inset showed the comparison of the ADP between the excitatory subtypes (non-ADP cells: n = 44 cells from N = 24 mice; ADP cells: n = 43 cells from N = 26 mice; p = 0.0003). (E) The Ri of the non-ADP cells was similar to that of ADP cells (non-ADP cells: n = 44 cells from N = 24 mice; ADP cells: n = 43 cells from N = 26 mice; p = 0.60). ***p < 0.001.

