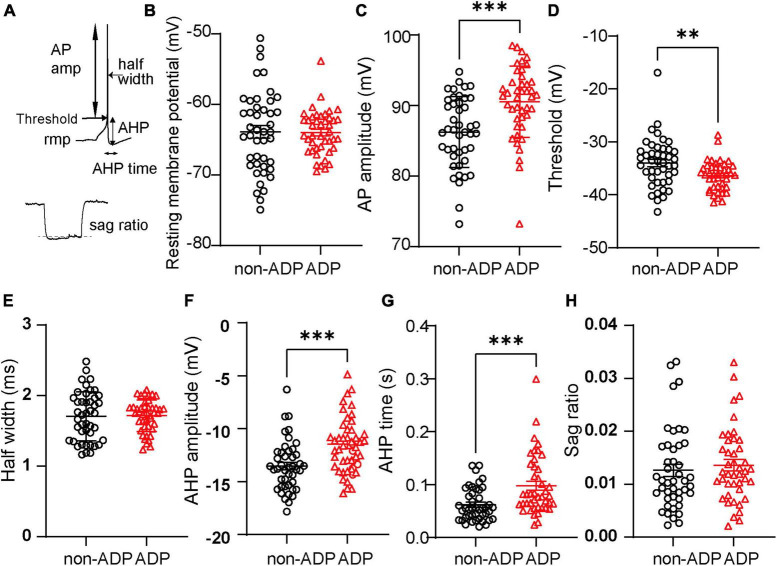
FIGURE 2.
Different intrinsic properties of the two types of RS cells. (A) Seven physiological parameters used for the analysis were resting membrane potential (rmp), AP amplitude, threshold, half-width of action potential (AP), after-hyperpolarized potential amplitude (AHP), AHP time, and sag ratio. (B) The resting membrane potentials (rmp) were similar between the two excitatory subtypes (non-ADP cells: n = 44 cells from N = 24 mice; ADP cells: n = 43 cells from N = 26 mice; p = 0.87). (C) The AP amplitude of ADP cells was larger than that of the non-ADP cells (non-ADP cells: n = 44 cells from N = 24 mice; ADP cells: n = 43 cells from N = 26 mice; p = 0.0001). (D) Threshold of action potential (AP) in the ADP cells was significantly deeper than in the non-ADP cells (non-ADP cells: n = 44 cells from N = 24 mice; ADP cells: n = 43 cells from N = 26 mice; p = 0.0023). (E) The half-width of the AP in the non-ADP cells was similar to that in the ADP cells (non-ADP cells: n = 44 cells from N = 24 mice; ADP cells: n = 43 cells from N = 26 mice; p = 0.82). (F) The AHP amplitudes significantly differed between the two excitatory subtypes (non-ADP cells: n = 44 cells from N = 24 mice; ADP cells: n = 43 cells from N = 26 mice; p = 0.0002). (G) The AHP time of non-ADP cells were significantly faster than that of ADP cells (non-ADP cells: n = 44 cells from N = 24 mice; ADP cells: n = 43 cells from N = 26 mice; p = 0.0003). (H) The sag ratio was similar between the two excitatory subtypes (non-ADP cells: n = 44 cells from N = 24 mice; ADP cells: n = 43 cells from N = 26 mice; p = 0.34). **p < 0.01, ***p < 0.001.

