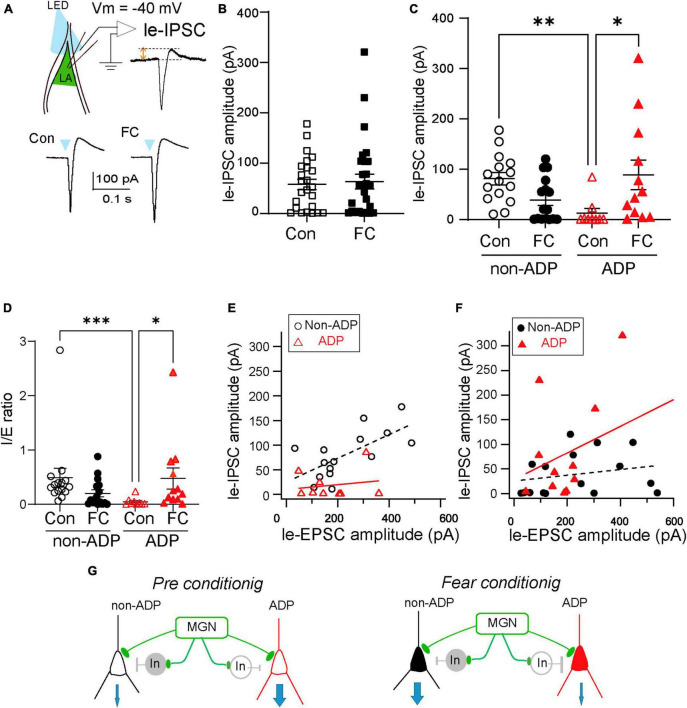
FIGURE 5.
The E/I balance variation depended on the excitatory subtypes. (A) The illumination of LED (every 20 s, 5 ms duration) evoked le-EPSCs followed by le-IPSCs in the excitatory cells at holding potentials –40 mV. (B) The le-IPSCs amplitude of all RS cells in FC mice (n = 28 from N = 11 mice) was similar to those in Con mice (n = 24 from N = 8 mice; p = 0.79). (C) Comparison of the le-IPSCs amplitude in Con and FC mice within the same subtypes and comparison of the subtype differences in the le-IPSCs amplitude from Con and FC mice. The amplitude of le-IPSCs of ADP cells in the FC mice (n = 9 from N = 7 mice) was larger than that in the Con mice (n = 15 from N = 6 mice, p = 0.030). In Con mice, the amplitude of le-IPSCs in the non-ADP cells (n = 16 from N = 9 mice) was larger than in ADP cells (n = 15 from N = 6 mice; p = 0.0025). *p < 0.05, **p < 0.01. (D) Comparison of the I/E ratio of the non-ADP and ADP cells between the Con and FC mice. Comparison of the I/E ratio of the Con and FC mice between the subtypes. The I/E ratio was significantly higher in the FC group (n = 15 from N = 6 mice) than in the Con group of ADP cells (n = 9 from N = 7 mice; p = 0.020). Between the subtypes, the I/E ratio of the non-ADP cells was significantly larger than that of the ADP cells in Con mice (non-ADP: 0.49 ± 0.17, n = 16 from N = 9 mice, ADP: 0.047 ± 0.025, n = 15 from N = 6 mice; Kruskal–Wallis test with Dunn’s post-hoc test, p = 0.0008). (E) The relationship between the le-EPSCs and le-IPSCs amplitude between subtypes in Con mice (open black circles: non-ADP cells, n = 15 from N = 6 mice; open red triangles: ADP cells, n = 9 from N = 7 mice). (F) The relationship between the le-EPSCs and le-IPSCs amplitude between subtypes in FC mice (filled black circles: non-ADP cells, n = 16 from N = 9 mice; filled red triangles: ADP cells, n = 12 from N = 7 mice) *p < 0.05, **p < 0.01, ***p < 0.001. (G) Schematic diagram of the aversive learning-induced I/E balance changes. In the Con group, the inhibition input into non-ADP cells was larger than that into ADP cells (left panel). After aversive learning, feedforward inhibition in ADP cells increased, and the I/E balance drastically changed. On the other hand, feedforward inhibition in non-ADP cells slightly decreased, and the I/E balance reversely changed. The I/E balance change may have contributed to the weight of the relative outputs of the non-ADP and ADP cells (right panel).

