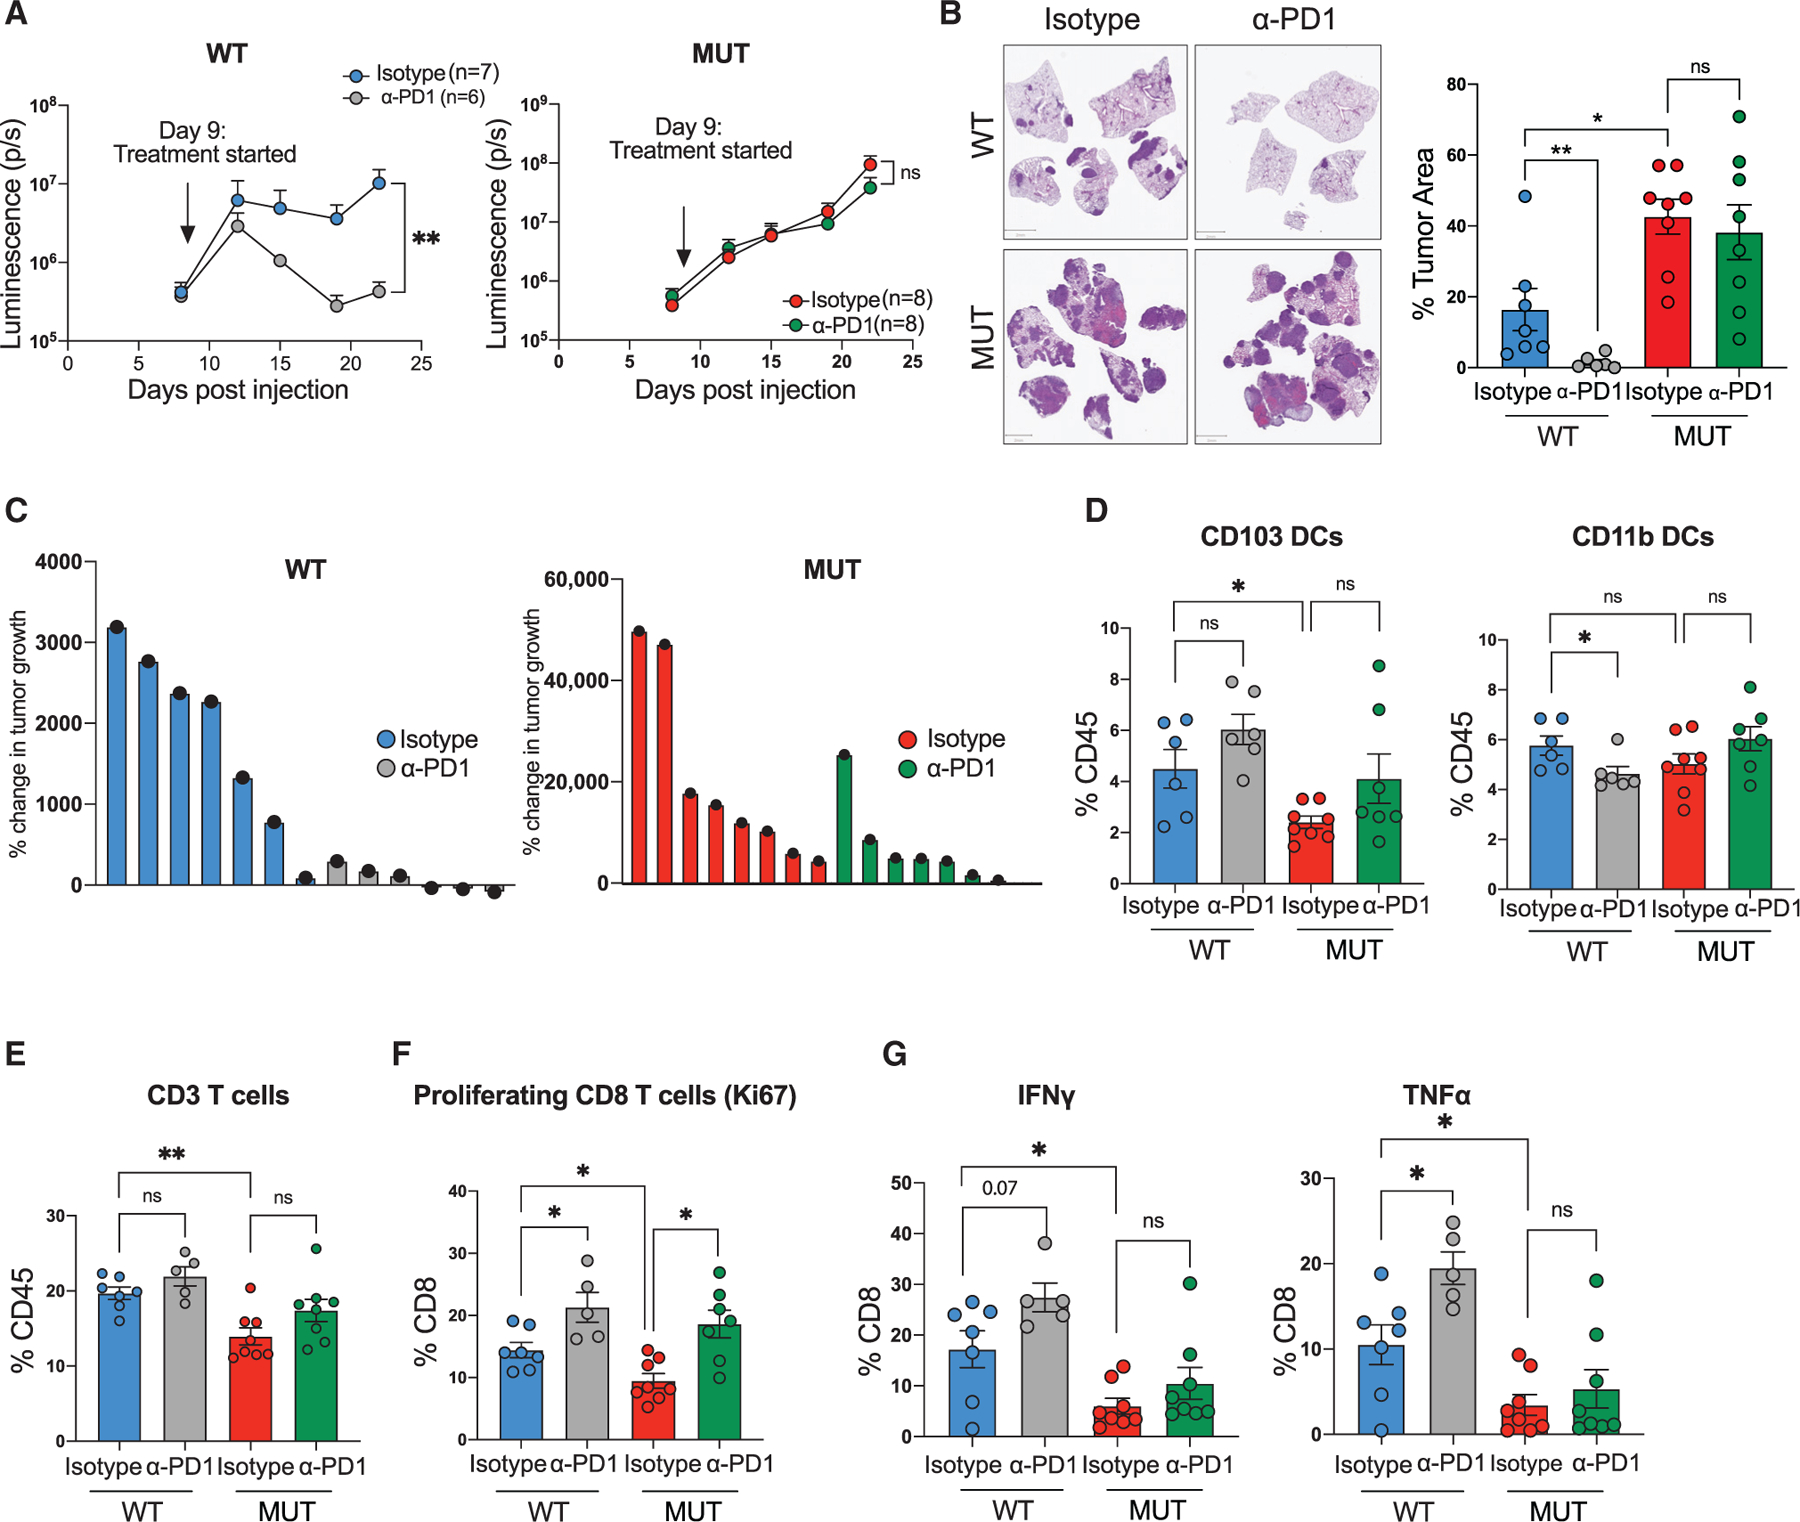
Figure 4. Keap1 mutation drives immunotherapy resistance in antigenic Kras-driven lung adenocarcinoma mouse model.

(A) Growth kinetics of Keap1 wild-type (WT, left) and mutant (MUT, right) KP cells injected intravenously in female C57BL/6J hosts upon treatment with anti-PD1 monoclonal antibody or isotype control. Each experimental subgroup had n ≥ 6 mice.
(B) Representative images of lung tumor burden and quantification (tumor area/total lung area) by H&E staining of Keap1 wild-type and mutant orthotopic tumors treated with either isotype or α-PD1. Scale bars, 2 mm. Each experimental subgroup had n ≥ 6 mice.
(C) Waterfall plots showing the percentage of tumor growth of Keap1 wild-type and mutant lung tumors treated with isotype control or anti-PD1.
(D) Percentage of CD103 and CD11b DCs among tissue-infiltrating immune cells in the lungs of animals with Keap1 wild-type or mutant tumors treated with anti-PD1 or isotype control.
(E) Percentage of CD3+ lymphocytes among tissue-infiltrating immune cells. Each experimental subgroup had n ≥ 5 mice.
(F and G) Percentages of Ki67+ cells (F) or intracellular IFN-γ- and TNF-α-positive cells within the CD8 T cell gate in Keap1 wild-type and mutant tumor-bearing mice treated with anti-PD1 or isotype control. Each experimental subgroup had at least n = 5 mice. Each symbol represents an individual mouse. *p < 0.05; **p < 0.01.
