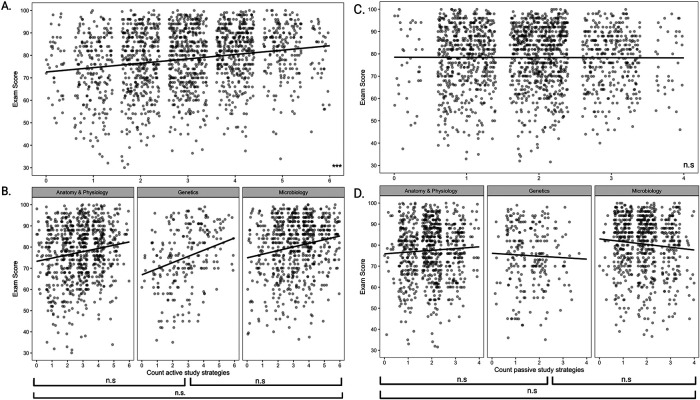
FIGURE 3.
To answer the question, “What is the effect of each study behavior on student performance?”, we correlated the study behaviors of students (i.e., those used for Exam one and Exam three) with performance. A) Count of active-study strategies used by students across all classes compared with student-exam score. B) Count of active-study strategies used by students in each course (i.e., Anatomy and Physiology, Genetics, and Microbiology) compared with student-exam score. C) Count of passive-study strategies used by students across all classes compared with student-exam score. B) Count of passive-study strategies used by students in each course (i.e., Anatomy and Physiology, Genetics, and Microbiology) compared with student exam score. *** represents statistical significance where p ≤ 0.001; ns indicates no statistical significance where p > 0.05.

