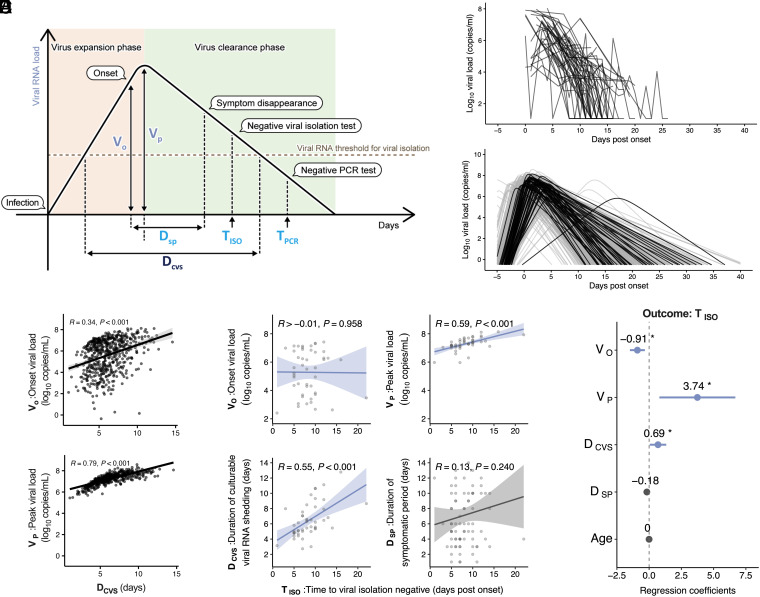
Fig. 2.
Quantification and characterization of the dynamics of viral RNA shedding: (A) Illustration of parameters (Table 1) derived from virus dynamics related to time and amount. (B) The measured values of individual viral RNA dynamics in the respiratory samples obtained from the FF100 cohort. (C) The reconstructed individual-level viral RNA dynamics based on mathematical modeling. Black and gray colors correspond to the viral loads calculated from the FF100 and NBA cohorts, respectively. (D) Correlation between the features extracted from the reconstructed individual-level viral RNA dynamics. Regression lines with 95% CIs, Pearson correlation R values, and P values are shown. (E) Association between the infectious virus shedding period and the features extracted from the reconstructed individual-level viral RNA dynamics. Correlation between post-onset time to viral isolation negative ( ) and onset viral load ( ), peak viral load ( ), duration of culturable viral RNA shedding ( ), and duration of symptomatic period ( ) are shown, respectively. (F) Multiple regression analysis of the infectious virus shedding period ( ), including the features extracted from the reconstructed viral RNA dynamics. Forest plot showing regression coefficients and 95% CI. Statistical significance: ns, not significant; *P < 0.05; **P < 0.01; ***P < 0.001; ****P < 0.0001.

