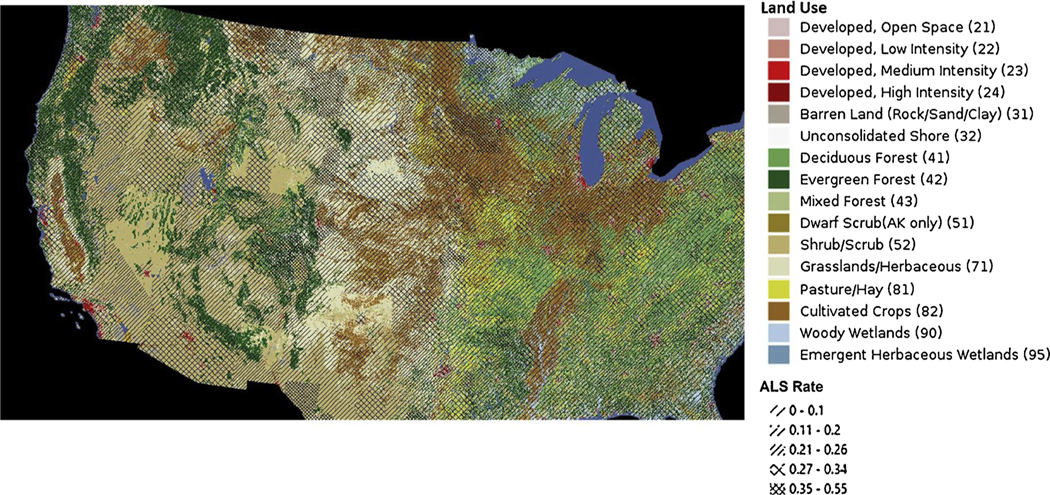
Fig. 4. ALS rates overlaid with USGS Land Use categories.

Dark brown depicts ‘cultivated crops’. Dense cross-hatching shows zip3 regions with the highest ALS rates for the Symphony cohort.

Dark brown depicts ‘cultivated crops’. Dense cross-hatching shows zip3 regions with the highest ALS rates for the Symphony cohort.